
Description
App Information Clock Tuner
- App NameClock Tuner
- Package Namecom.athumbsoft.pendulumtuner
- UpdatedMay 16, 2017
- File SizeUndefined
- Requires AndroidAndroid Varies with device
- Version
- DeveloperAThumb Inc.
- Installs10,000 - 50,000
- PriceFree
- CategoryTools
- Developer
- Google Play Link
Clock Tuner Version History
Select Clock Tuner Version :-
Clock Tuner 2.61 APK File
Publish Date: 2017 /5/17Requires Android: Android 4.4W+ (KitKat, with wearable extensions, API: 20)File Size: 2.8 MBTested on: Android 7.1 (Nougat, API: 25)File Sha1: a82a04bef524d057e66a2ee0032a1ed8dd1a20c4 -
Clock Tuner 2.61 APK File
Publish Date: 2017 /5/26Requires Android: Android 4.4W+ (KitKat, with wearable extensions, API: 20)File Size: 2.8 MBTested on: Android 7.1 (Nougat, API: 25)File Sha1: a82a04bef524d057e66a2ee0032a1ed8dd1a20c4 -
Clock Tuner 2.61 APK File
Publish Date: 2017 /5/23Requires Android: Android 4.4W+ (KitKat, with wearable extensions, API: 20)File Size: 2.8 MBTested on: Android 7.1 (Nougat, API: 25)File Sha1: a82a04bef524d057e66a2ee0032a1ed8dd1a20c4 -
Clock Tuner 2.61 APK File
Publish Date: 2017 /5/20Requires Android: Android 4.4W+ (KitKat, with wearable extensions, API: 20)File Size: 2.8 MBTested on: Android 7.1 (Nougat, API: 25)File Sha1: a82a04bef524d057e66a2ee0032a1ed8dd1a20c4 -
Clock Tuner 2.60 APK File
Publish Date: 2017 /5/15Requires Android: Android 4.4W+ (KitKat, with wearable extensions, API: 20)File Size: 2.8 MBTested on: Android 7.1 (Nougat, API: 25)File Sha1: 488a3fcc6a2bdcdf1768557452288b31e6f95d47 -
Clock Tuner 2.11 APK File
Publish Date: 2015 /12/24Requires Android: Android 2.3+ (Gingerbread, API: 9)File Size: 2.8 MBTested on: Android 5.1 (Lollipop, API: 22)File Sha1: 3ef6228cf5ecd75b44338b7c1358c168282ca179
AThumb Inc. Show More...
")

Clock Tuner APK
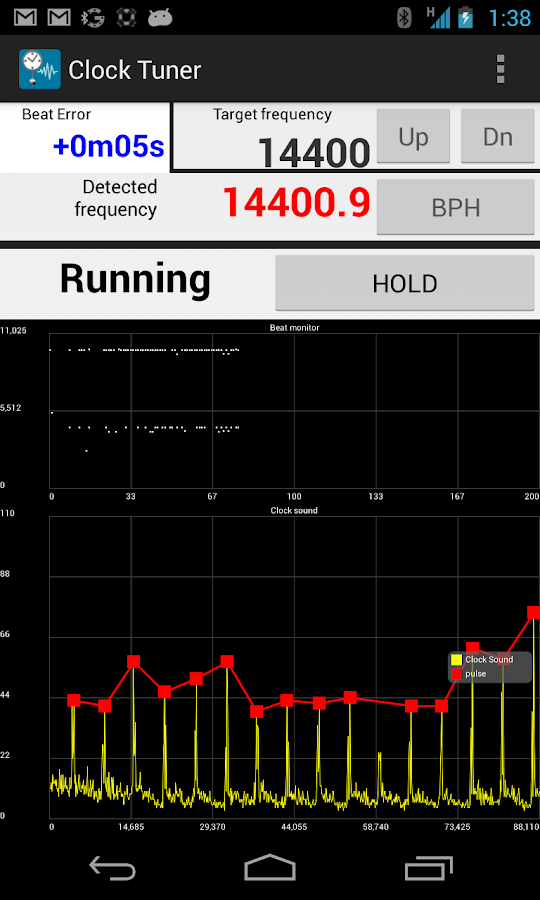
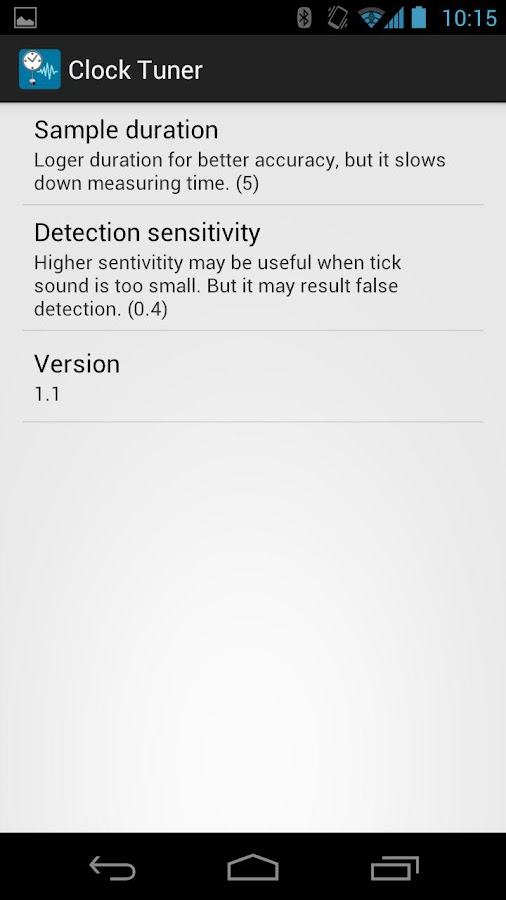
A TimegrapherThis app is to measure the BPH(Beats per hour) of mechanicalwatches.It will display time error per day as well.The app uses microphone to measure BPH.** Recommend to plug a microphone into phone and attach themicrophone to the back of your watch.** Basic version display wave graph and pulse intervalhistogram.** Frequency display requires 'Premium' upgrade.** Please test the app with your watch before you purchase'Premium' upgrade. The app will work as Premium during 30min.Not for digital clocks.Not working in noisy environment.Set microphone direction toward a clock.- Review from Mr. Kojimahttp://www.thewatchsite.com/index.php/topic,42142.0.html- Preset exampleRolex or mechanical watch: Target frequency: 4 or 5Hz, Sampleduration: 2Sec, Sensitivity: manual 50Most pendulum clock: Target frequency: 1 or 2 Hz, Sample duration:5 or 10 Sec, Sensitivity: mediumFAQ.1) in the settings there is a sensitivity option with a high,medium, low and 3 manual settings, can you explain how this changesthe resultsIt determines sound amplitude threshold for detecting clock sound.If your clock sound is loud you may reduce sensitivity. This willallow more environmental noises.If you increase the sensitive, you may measure hand watches. Butsmall noise may measurement errors.2) why does the detected frequency change between light grey, blackand redRed means smaller drift during the measurement interval while greymeans that measurement may have an error.3) the average frequency does not always calculate, it stays atNaNThe 'detected frequency' should be red continuously.4) how do you calculate the pulse drift %abs(max detected frequency - min detected frequency) / detectedfrequency during 1 detection cycle.5) what are the 2 graphs showing and what data are you using forthe calculationsThe size of bars in the upper graph should be almost thesame.The bottom shows amplitude of sound wave recorded from microphone.6) are newer versions of the app being developed** You may provide sound sample by sending wav or mp3 file [email protected]
Similar Apps Show More...


Hairspring 1.2.2 APK
Hairspring turns your device into a powerfulmechanical watch timing machine. It measures the precision ofmechanical watches, with an accuracy of at lease ±1s/day, byanalyzing the tick-tock sound using the microphone of the device.It supports a wide range of frequencies, covering almost allmechanical watches available on the market:- 14,400 VPH- 16,200 VPH- 18,000 VPH- 19,800 VPH- 21,600 VPH- 23,400 VPH- 25,200 VPH- 28,800 VPH- 36,000 VPHIn case you don't know your watch's frequency, you may usefrequency auto detect.The measuring time can be set from 30 seconds to 3 minutes, toget a balance between response time and accuracy.An oscilloscope shows the audio waveform in real time. It'squite handy for monitoring the status and diagnosing some commonproblems.The result is plotted in a chart, which can be saved for laterreference. Also, it can record and save a long-time measurement,e.g. for 12 hours, to analyze the long-time performance of thewatch.To use Hairspring, just place the microphone tightly close tothe watch back, then set the parameters. After collecting enoughdata, the result will be shown.A detailed usage guide can be found here: http://www.diversminds.com/Hairspring/Hairspring.php*** PLEASE NOTE ***- This is a Lite version of Hairspring, with the accuracy limitedto 1 min/day.To get accuracy of 1 s/day, you need to upgrade to premium version,using in-app purchase.- Hairspring requires a sensitive microphone. Make sure it workswith your microphone before upgrading.


Watch Accuracy 1.3.4 APK
Curious about how accurate your watch reallyis? This tool will let you know.Take a snapshot of your watch, save it and list results. Switchprofiles and track the accuracy of your collection.In case of any bugs, please report them, we will do our best torelease the update.Wishes? We are listening to you. Enjoy.


Power Toggles APK
An advanced power control widget. FREE and Noadshttps://github.com/sunnygoyal/PowerTogglesNote: Many toggle (GPRS, NFC, AirplaneMode...) are not working onLollipop even with root. This is a known issue. I am still lookingfor a fix.For creating a Tasker toggle, referhttp://powertoggles.com/tasker/For concerns regarding SuperUser permission:http://m.powertoggles.com/help.php?e=26 ,https://plus.google.com/103583939320326217147/posts/T9xnMJEnzf1FAQ: http://powertoggles.com/help/(****** Note: Do not install on SD card ******)**Call phone permission is required for adding direct callshortcuts on the widget.Contains 40+ toggles includingWifiMobile Data (3G/4G)Bluetooth (toggle, discovery and tether),FlashlightCustom application shortcutCustom system shortcutsAnd many more...Supports homescreen widgets and notification widget. Also supportsexpandable notification widget on Jelly Beans and above.Lockscreen widgets on android 4.2+Many customization options like changing color theme and icons forindividual toggles.Backup and share widget settings from the widget configure screen(Menu > Import / Export) as well as various themes formulti-icon toggles and battery toggle.Permissions:android.permission.ACCESS_SUPERUSER: Required for running rootcommands. No effect on non-rooted phones. Users will still get theprompt asking for permission when running root command.http://m.powertoggles.com/help.php?e=26android.permission.CAMERA: Required for the flashlight towork.android.permission.SYSTEM_ALERT_WINDOW: required to display atoggle choice popup when using notification widget (Only ongingerbread)Note: on gingerbread, direct notification toggle is not possible.The clicking the notification widget, it displays a popup to choosean action.Feel free to suggest more toggle button ideas.Please go through the Help and FAQ section in the app (fullysearchable) twice before reporting a bug, most likely it is alreadyanswered there.It is difficult for me to reply to each email individually, some ofthe emails may get lost in the huge list of unread mails. If you donot get a reply within a week, ping me again.
 3.4.2")
CPU tuner (Rooted phones) 3.4.2 APK
CPU tuner gives you control over the powerconsumption of your android device.Its prime purpose is to be a battery saver and to save as muchbattery as possible, but it can be used to overclock at the sametime (if the kernel of your device supports it).Depending on triggers (based on the battery) different profilesare loaded. Each trigger has different profiles depending of thethe state of your phone (if it is locked, on battery, on power or aphone call is being done).A profile can modify the following:* The CPU governor, its thresholds and min/max frequencies off yourCPU (i.e. setCPU speed).* The state of services like:- mobiledata connection- 3G/2G switch- background sync- wifi- bluethooth- airplane modeConfigurations (i.e. a set of trigger and profiles) can be loadedbased on the time of the day and the day of the week. This allowsyou to set a different behaviour during the night or theweekend.In praise of CyanogenMod... ;)If you use and like this app please subscribe to the mailinglist [email protected] participate in the forums on https://sourceforge.net/projects/cputuner/(Project webpage).You can follow CPU tuner on: https://plus.google.com/109797451979104819882If you want to help translating please join in at http://www.getlocalization.com/cputuner/.Please report errors in a mail to the address listed below notin a market comment.You best generate a capabilities report first, by going to settingsthen to backend and choose capabilities report, when it is done hitsend (and save the mail as draft). Then describe your issue (and ifpossible attach a logcat output along with the zip file from thereport).A note on permissions: Yes there are a lot and potentiallydangerous permissions needed, but cpu tuner does not request thenetwork communication permission which means that cpu tuner cannotsend any information back. Further more cpu tuner is opensource soyou can browse the code and check....

Digital Clock Live Wallpaper-7 4.2 APK
Digital clock as application, Live Wallpaper and widget thatdisplays the current time, date, month, year, day of the week,battery charge and can hint the current time by voice. All date andtime formats are supported. Names of month and day of the week aredisplaying according to current language. Features: * Show gloweffect, 3D effect, shadow; * Show date, day of the week, seconds,battery charge, lead zero for hours; * Select a primary color; *Ten kinds of fonts including digital, LCD, pixel; * Select size ofsecondary font for display date, seconds, etc.; * Use short or longdate format; * Time to speech by double tap or one tap for widgetor periodically. Special setting for app: * Keep a screen on.Special settings for widgets: * Show date, month, day of the week,seconds; * Select color; * Action by tap: open this app, open aninbuilt alarm app; * Use long touch on a widget for enter resizemode (and call to settings for Android 12). Special settings forLive Wallpaper: * Resize a clock; * Align a clock on the Homescreen. Additional features according to global settings: * Alldate formats are supported; * The native language for display amonth and a day of the week is supported; * 12 hour and 24 hourtime formats are supported.
Tools Top Show More...


NetLoop VPN 5.0.4 APK
NetLoop is formerlyknownasSimpleAndroid ServerThis app contains a Proxy Server and aFreeVPN.The VPN is not a full featured VPN. it is notprovidedforsecuritybut for tunneling purposes.if you are using NetLoop's proxy serveroptionpleasemakeremove any existing proxy server address inyourdevice'sAPNsettings. Failure to do this will cause Some ofyourapps not togothrough the VPNVPN features:• HTTP request Compression.•Ability to modify TCP connection parameters.• Ability to use hotspot over VPN ( Requires root )•Ability to use multiple concurrent connections to theVPNserversforthe best Network usage experienceLocal server features:•modify outgoing requests.•specify alternate proxy servers to send a request through•provide alternate headers and ability to stripheadersfromincominghttp responses•ability to choose number of connections to be maintainedbytheapp(good for power management)•ability to share configurations throughanyfiletransfermethod.•System wide proxy serviceif you are to use this app with the proxyserverfeature,makesure that the device's proxy serverfeatureisdisabled:.to use a received config.json fileasthecurrentsetting:•locate the received file using any file manager ofyourchoice•open the share menu of the file manager and select"usefileasconfig"OR•Launch NetLoop and use Load ConfigThe Profiles Feature lets youeasilyswitchbetweenconfigurations when using NetLoopEnjoy!!.

FREE WiFi Password Recovery 4.3 APK
Need to re-connect your new device to WiFinetwork, but forgot your password? Want to share a WiFi password ofrandom characters with your friend?Use FREE Wifi Password Recovery to backup all WiFi passwords onyour device, and restore it when you need them with just one click!Share with friends through SMS or email. Yes, just that easy!FREE Wifi Password Recovery features:■ LIST, BACKUP & RESTORE all network's (WiFi) password savedon your device!■ Show SSID and Password on fullscreen (for easy viewing andsharing with others)■ Copy WiFi Password to Clipboard (to be able to pasteanywhere)■ Show QR Code (to another device scan and access thenetwork)■ Share password through SMS or EmailPlease Note that FREE Wifi Password Recovery:① only works on rooted devices (needs super-userpermissions).② is not a WiFi password cracker. NOT intended to crack WiFinetworks.③ needs previous access to WiFi networks with your device toretrieve passwords.❐ Please understand that FREE Wifi Password Recovery is a freeapp and contains ads to support develop cost. For ads free app, wehave a paid version - check out in Play Store:http://goo.gl/elnAHS❐ Why FREE Wifi Password Recovery only works on a rooteddevice?Because your device stores WiFi passwords when you connect to a newWiFi network. You are not able to access the passwords and retrievethem unless you have super-user permissions. Checkout here for moreinformation on root: http://www.androidcentral.com/root❐ Please don’t hesitate to contact([email protected]) for any issues you may have; and dogive us 5 stars if you like us! Thanks & enjoy!

XAPK Installer 1.4 APK
Say goodbye to Android APK OBB Installing error problem, XAPKInstaller makes that easier and faster than ever.• Scan and preview all .apk file on your phone and SD Card• Delete or install APK, XAPK ( APK with cache data or obb file)automatically• Download XAPK, APK free online with your Android phone andtabletXAPK Installer for PC is available that allows you to install.apk files from Windows XP, Vista, 7, 8. 8.1 to Android devices.Learn More: http://apkpure.com/apk-install.htmProblems downloading or installing APK with XAPK Installer? Seehttp://apkpure.com/xapk.htmStill need more help? Please tell us more about the issue onFacebook. https://www.facebook.com/apkpure

ENGIE - Convivium APK
Convivium, l’applicazione ENGIE pensata per semplificare la vitanelcondominio! Convivium gestiste, per l’amministratore e icondòmini:• SEGNALAZIONI TECNICHE: facilita la gestione dellerichieste diintervento, aggiornando i condòmini e l’amministratorein temporeale sullo stato di avanzamento • MESSAGGIAMMINISTRATORE:semplifica la comunicazione tra condomino eamministratore suscadenze, assemblee e molto altro • ARCHIVIODOCUMENTI: raccoglie idocumenti importanti del condominio, comeverbali e preventivi •CONTATTI UTILI: gestisce la rubrica con icontattidell’amministratore, dei condòmini e dei fornitori delcondominio,come l’idraulico e l’elettricista • BACHECA SOCIAL:crea unacommunity tra i condòmini per scambiare informazioni eavvisi utiliL’applicazione è dedicata agli amministratori chegestisconocondomini clienti ENGIE e a tutti i loro condòmini.ACCESSOCONDÒMINI: per accedere è necessario seguire la proceduradiregistrazione condòmino, indicando come codice condominio ilCodiceFiscale del condominio ACCESSO AMMINISTRATORI: per accedereènecessario utilizzare le credenziali impostate per lapiattaformaweb Si segnala che la grafica e la navigabilità dell’appConviviumsono ottimizzate per la navigazione da smartphone. Ituoisuggerimenti e le tue segnalazioni sono importanti per noi.Perqualsiasi necessità puoi chiedere supporto scrivendoall’indirizzoemail [email protected], saremo felici diaiutarti.

360 Security -Free Antivirus,Booster,Space Cleaner APK
Free Security Protection, Speed Booster andJunk Cleaner for Android PhoneTrusted by 200 million users, 360 Security is the #1 all-in-onepower cleaner, smart speed booster and antivirus app that optimizesyour background apps, memory storage, junk files & batterypower, keeping your device safe from virus and trojan.Download this powerful super cleaner master optimization &security app that’s intuitively designed to protect your mobilelifestyle in just ONE tap, making phones run like they're brand newall the time.Why 360 Security is a MUST-HAVE app?★It’s an Effective Speed Booster & Smart Cleaner-Lacking spacefor new apps and photos? Just clean app caches and junk files,boost your phone with ONE click!★It’s a Smart Battery Saver- Battery draining quicker than ever?Kill redundant apps that drain your battery and extends batterylife!★It’s a Virus Remover for android -Worried about viruses orphishing? 360 Security’s top antivirus solution makes sure yourdevice is free from malware, vulnerabilities, adware andTrojans!------------------------------------------Highlights of 360 Security►Security & AntivirusScan installed apps, memory card content and new appsautomatically. 360 Security’s latest protection technologiesagainst viruses, adware, malware, trojan and more.►Junk File CleanerDelete all types of junk files (system cache, image cache, videocache and advertisement cache) to free up the storage space.►Speed BoosterBoost speed to improve the performance and RAM of your phone, boostyour games to make them run smoothly.►CPU Cooler MasterIntelligently saves your device’s power by knowing when toautomatically trigger 360 Security’s Battery Saver feature and makeyour phone stay with durable power and never overheated.►Anti-theftAn all-in-one anti-theft solution, should you lose your belovedphone. A suite of features including, Erase, Locate, Alarm &Lock can assist you with retrieving the lost device and protectingpersonal data. You can trigger remote features via our webinterface at http://findphone.360safe.com►PrivacyPrivacy & App Lock – Prevent data on the device such asFacebook, Instagram, Whatsapp, Snapchat, photo albums and otherimportant & private documents from falling into the wronghands.►Intruder SelfieInstantly snap a photo of anyone who breaking into your apps andrecord the date & time in App Lock for check.►Fingerprint LockUnlock screen quickly and easily with your fingerprint if yourdevice has the fingerprint sensor, no fear of forgetting pattern orPIN code any more.►Real time protectionScan installed apps & local APK files and also monitor eachinstallation process, provide the best payment & shoppingsecurity.Protect your mobile device with 360 Security, a top of the linefree security app designed to protect your Android phone againstthe latest virus, malware, system vulnerabilities & privacyrisks. This super speed cleaner also clears application caches andjunk files from your system, increases the available storage spaceon SD card and boosts your Android phone for free.------------------------------------------360 Security is available more than 35 languages: English,Português(Brasil), Português(Portugal), Español(España),Español(Latinoamérica), Pусский, हिन्दी, ไทย, Bahasa Indonesia,Türkçe, Tiếng Việt, 中文(简体), 中文(繁體), Bahasa Melayu, 日本語, Deutsch,Français, 한국어, Italiano, Čeština, Nederlands, Svenska, Polski,Suomi, Română, Ελληνικά, Magyar, Hrvatski, Dansk, العربية, हिन्दी(भारत), Filipino / Tagalog, فارسی, Українська, Lietuvių (Lietuva),Slovenščina (Slovenija), Norsk, ភាសាខ្មែរ (កម្ពុជា), اردو زبان,etc.► Read in app permissions and usage here: ►http://goo.gl/3a2mCdWe would like to hear from you:Like us on Facebook:https://www.facebook.com/360safecenterJoin us on Google Plus Community:https://plus.google.com/communities/109670671299307805270

Undeleter Recover Files & Data 5.0 APK
Scan for and recover deleted files from memorycards and internal storage on rooted* devices.Without a jailbreak/root* access, Undeleter can only scan appcaches for images. READ BELOW FOR INFO ABOUT ROOT.For free, the app will restore all supported image file typesand all types of data, including SMS, call logs and WhatsApp orViber conversations. It will also shred and secure delete.Unlock it to recover other supported file types, remove ads andenable background scanning.*ROOT/SUPERUSER PERMISSIONS require that you modify theoperating system on your device, visit this website for moreinformation: http://www.androidcentral.com/rootApp caches can contain images that would not otherwise bediscoverable: you may find photos that were shared with you onsocial media but you never opened, or lower quality copies ofimages you have now or have deleted in the past. They may alsocontain images that have been preloaded by your browser or otherapps on your device - even images of people you don't know. Theycan be filtered out using "Hide extant files".File types: Journal scanning can discover files with anyconceivable extension. Essentially these files are still on yourvolume with their data in allocated sectors. Journal scan is onlyavailable on EXT4 and derived file systems.Deep scan heuristically scans for and recovers the following typesof files: BMP, JPEG/JPG, PNG, MNG, JNG, GIF, MP4, AVI, MKV, MP3,OGG, OGM, WAV, FLAC, AMR, MP4A, PDF, SXD, SXI, SXC, SXW, ODT, ODG,ODS, ODP, DOCX, XLSX, PPTX, ZIP, JAR, APK, EPUB.Data scanning is available for a select number of apps, includingthe system phone and SMS applications. Data will be recovered inthe form or HTML files for WhatsApp and Viber, as we cannot mergethird-party catalogs.Shred/secure delete: Files found on free disk areas can be erasedpermanently in bulk using the Shred function. You can also use thesystem-wide Share menu to securely erase files directly through anyother app, for example by opening the gallery, selecting a numberof images, pressing the Share button and selecting Securedelete.ACCOUNT - needed for Google Drive and Dropbox uploadCALL/SMS - needed for app data scanner - deleted SMS and calllogsLOCATION - for ads

Security Master - Antivirus, VPN, AppLock, Booster APK
The original CM Security upgraded to thewhole new Security Master Antivirus&VPN(by CM, Cheetah Mobile)and redefined the scalp of Phone Security: protects not only yourphone but also your privacy. Instead of providing all the popularfeatures, Security Master Antivirus&VPN(by CM) introducedIntelligent Diagnosis to detect your phone status and advise neededsolution, including Antivirus, Junk Clean, and Phone Booster(Battery Saver, and CPU Cooler) in time. Furthermore, westrengthened the protection of privacy by creating a shield for allonline activities through SafeConnect VPN.★SafeConnect VPNSecurity Master Antivirus&VPN(by CM) presents the mosteasy-to-use free VPN, proxy & unblock solution. Apart fromother VPN, SafeConnect VPN partners with “Hotspot Shield Free VPNProxy” and was designed for everyone. SafeConnect VPN establishes asecured cyber environment as you need to block out hackers. WithSafeConnect VPN, you can apply virtual location to enhance securityand freely access favorite contents. Security MasterAntivirus&VPN(by CM) now protects not only your device, but theprotection extends to online data transmission to prevent leak ofonline banking information, private messages, and browsing history.(Will be available worldwide soon.)★Intelligent DiagnosisOur famous big button design upgraded to intelligently diagnoseyour most needed solution. All solutions to keep your phone safe,clean, and optimized like a new one, including battery.Antivirus - Security Master Antivirus&VPN(by CM) equips thecertified #1 antivirus engine. It detects 100% of virus &malware by customized scan and removes virus & malware. Itprotects phone and also your personal information against malware,spyware, and hackers.Junk Clean - Phone stores junk files automatically from time totime. Security Master Antivirus&VPN(by CM) detects this issueand frees storage when needed. One tap to clean cache & junkfiles at once. The smartest way to clean and optimize phone.Phone Boost, Battery Saver, and CPU Cooler - Your phone can nothave the best performance if it stays at a high temperature or highmemory usage. Especially when charging battery and playing games,it watches out phone & battery and keeps your phone cool, fast,and saves more battery life.★Message SecurityWorry about others peeping your message notifications? SecurityMaster Antivirus&VPN(by CM) hides notifications timely toprotect your privacy by Message Security. It gathers all chatnotifications into one and makes them easier to read &manage.★AppLockSecurity Master Antivirus&VPN(by CM) protects the privacy ofapps by AppLock. You can lock anything you want to protect, such asBluetooth & Wi-Fi switches, incoming calls, recent apps,settings, photos, WhatsApp, or any apps you choose. Furthermore,the preview of notifications can be also locked so that no one cansee which apps you are using or who you are chatting with.With Applock, you can lock apps with a pattern, PIN code, orfingerprint. Fingerprint lock is supported on Samsung or Androiddevices 6.0 and above that are equipped with fingerprint sensors.You can also customize the re-lock time to re-lock at device screenoff so that no need to unlock each time you launch an app.Intruder Selfie - Security Master Antivirus&VPN(by CM) protectsapps privacy from snoopers. If someone tries to unlock your appwith a wrong password, the photo of the intruder will automaticallybe taken and the intruder alert will be sent to you by e-mail. Itkeeps your phone safe and further tells who the intruder is.Disguise cover - Security Master Antivirus&VPN(by CM) disguiseslock screen so that no one is aware of you are using AppLock whilekeeping your secret & privacy safe. You can protect yourprivacy without your parents, partner, or children knowing.Theme - You can choose style of lock screen from hundreds ofAppLock themes or customize with your photos.