


Description
App Information Vernier Graphical Analysis
- App NameVernier Graphical Analysis
- Package Namecom.vernier.android.graphicalanalysis
- UpdatedNovember 12, 2016
- File SizeUndefined
- Requires AndroidAndroid Varies with device
- Version
- DeveloperVernier Software & Technology
- Installs10,000 - 50,000
- PriceFree
- CategoryEducation
- Developer
- Google Play Link
Vernier Graphical Analysis Version History
Select Vernier Graphical Analysis Version :-
Vernier Graphical Analysis 3.2 APK File
Publish Date: 2018 /10/16Requires Android: Android 4.3+ (Jelly Bean, API: 18)File Size: 18.1 MBTested on: Android 6.0 (Marshmallow, API: 23)File Sha1: 78bb004f01e1b9662cbbf3c7967c338782ca13f9 -
Vernier Graphical Analysis 3.1.1 APK File
Publish Date: 2017 /3/16Requires Android: Android 4.3+ (Jelly Bean, API: 18)File Size: 17.4 MBTested on: Android 6.0 (Marshmallow, API: 23)File Sha1: 6f5a2c98502463f120cc83e0260d5315af8775a8 -
Vernier Graphical Analysis 2.4 APK File
Publish Date: 2016 /2/9Requires Android: Android 4.3+ (Jelly Bean, API: 18)File Size: 14.9 MBTested on: Android 6.0 (Marshmallow, API: 23)File Sha1: 512c523cee5262d0d656cded84dbbbefe0d0afd6 -
Vernier Graphical Analysis 1.2 APK File
Publish Date: 2015 /9/6Requires Android: Android 4.1+ (Jelly Bean, API: 16)File Size: 9.6 MBTested on: Android 5.0 (Lollipop, API: 21)File Sha1: ca7096903f9b3adfe07db5cab8d83bea8e7df732
Vernier Software & Technology Show More...

Vernier Graphical Analysis APK
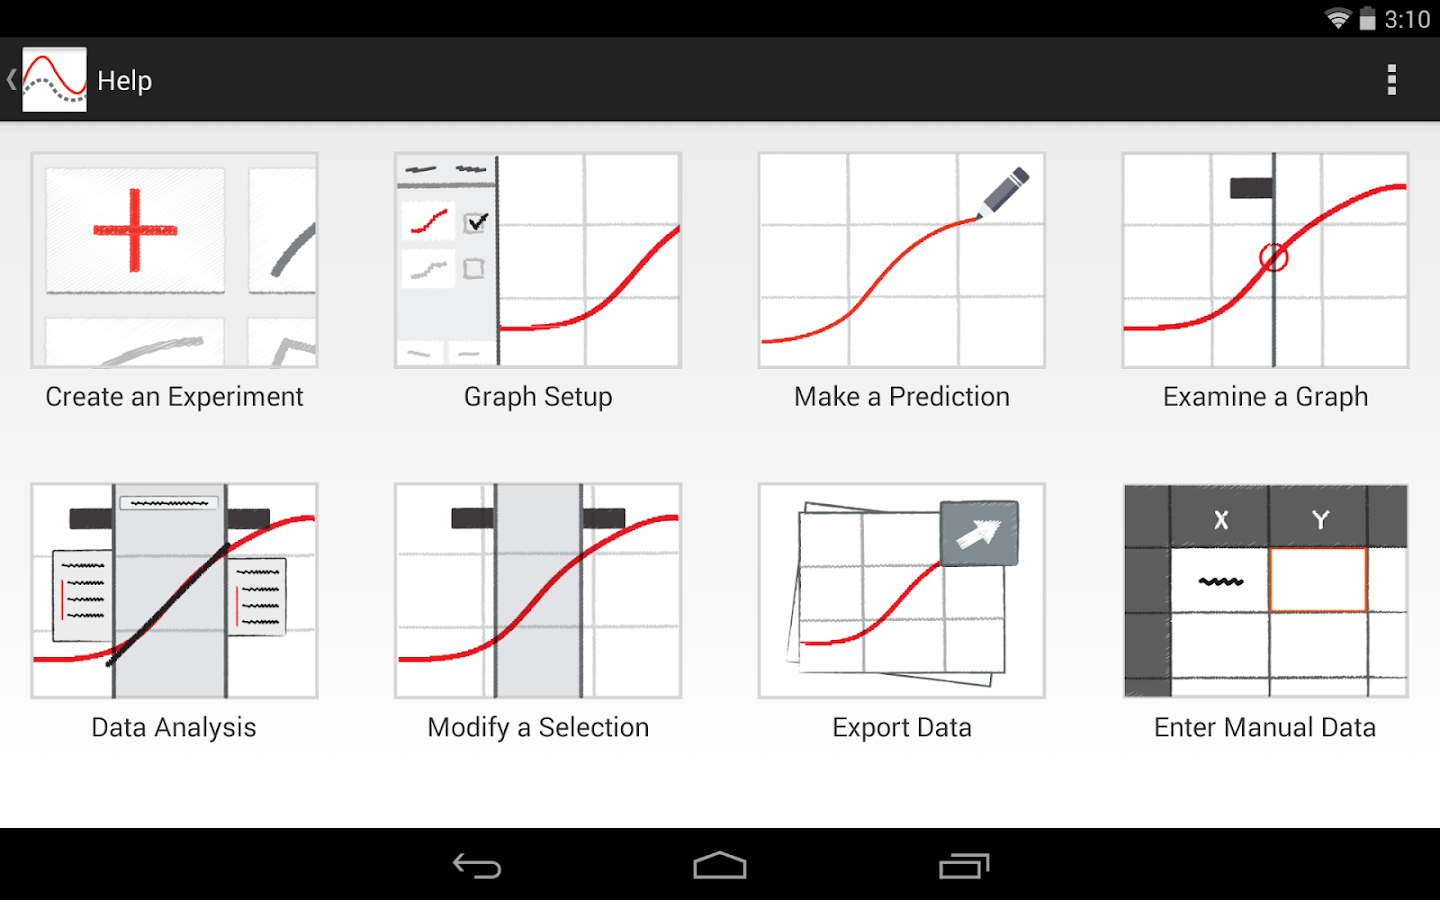
Version 3.0 supports Android devices runningOS versions 4.3 and newerVersion 1.2 supports Android devices running OS versions 4.1 -4.2.2Use Graphical Analysis to seamlessly collect, analyze, and sharesensor data in science and math classrooms. Graphical Analysisfacilitates student understanding with real-time graphs ofexperimental data. Students are able to enhance their lab reportsby easily determining statistics, performing curve fits, and addingannotations.Graphical Analysis, in combination with supported hardware, makesit possible to use your mobile device to collect data from a widerange of Vernier sensors, including temperature, motion, force, pH,and more. You can also collect data from your mobile device’s builtin accelerometers or manually enter data into the data table foranalysis. Data can be wirelessly streamed to each member of a labgroup using the Data Share features of LabQuest 2 or a computerrunning Logger Pro.Once data have been collected or entered into Graphical Analysis,students can analyze the data, export data and graphs to create alab report, or send their finished work to the teacher. Graphs canbe exported to Photos, Mail, or note-taking apps, or printed on aprinter. A CSV file of the data can be shared with other users oropened in different software, such as a spreadsheet program, foradditional analysis.Key Features - Data Collection• Use LabQuest Stream to collect data from up to five sensorssimultaneously.• Collect and analyze data from a Go Wireless sensor or Go WirelessLink and a compatible Vernier sensor.• Stream data to multiple students from a single source viawireless Data Sharing with LabQuest 2 or Logger Pro.• Collect acceleration data using your mobile device's built-inaccelerometers.• Collect time-based or event-based data.• Manually enter data and analyze them using GraphicalAnalysis.Key Features - Data Analysis• Display one, two, or three graphs simultaneously.• View data in a table.• Edit and auto-save data, graphs, annotations, statistics, andcurve fits.• Draw predictions on a graph.• Pinch to scale graphs.• Examine and select data.• Perform curve fits, including linear, quadratic, naturalexponent, and more.• Create text annotations and add graph titles.• Export graphs and data.Vernier Software & Technology has over 30 years of experiencein providing effective learning resources for understandingexperimental data in science and math classrooms. GraphicalAnalysis is a part of our extensive line of sensors, interfaces,and data-collection software for science education.

Vernier Go Wireless 1.0 APK
The Vernier Go Wireless app allows users toconduct experiments using Go Wireless Temp, a wireless temperatureprobe. Users collect temperature data that is displayed in a graphand can calculate basic statistics on a region of data.Additionally, users can export the data as a CSV file for use inother applications for even more analysis.HARDWARE REQUIRED - Vernier Go Wireless Temp is required to makeuse of this application. Visit http://www.vernier.com/gw-temp for moreinformation.Features when using a Go Wireless TempFrom the list of available sensors• Discover nearby Go Wireless Temp probes and monitor theirtemperature readings• Connect to a specific sensor for further studyWhen connected to a specific sensor• View live temperature values displayed in a thermometer bar• Collect data – displayed in a graph• Graph scales automatically to show all collected data• Customize the sensor name, view battery status, and flash thesensor LED (identify)• Toggle units• °C and °F (US – English only)• °C and K (all other languages)With collected data• On the graph - Pinch to zoom /double tap to autoscale• Tap to examine the collected data• Select a region to calculate the average temperature• Tap the statistics box to view additional statistics• Export a CSV file for additional analysis in other softwareExperiment possibilities include• Science fair projects• Monitoring environmental conditions• Monitoring temperatures in a fish tank or greenhouse• Measuring the rate of temperature change of a liquid in aThermos™• Measuring the temperature of the air coming from an airconditioner or furnaceVernier Software & Technology has over 30 years ofexperience in providing effective learning resources forunderstanding experimental data in science and math classrooms. GoWireless is a part of Vernier’s extensive system of sensors,interfaces, and data-collection software for science education.
Similar Apps Show More...


Basic Measure App 1.4.0 APK
This App is a bundle of Caliper, Micrometerand Osciloscope Simulator app that also we distribute as free appin another link. The free version is an app that have advertiseinside, and we distribute as separate app. With just about $ 1 youcan get that three app and nothing advertise that may distrubingyou, and protect your kid from unwanted ads that appear where theyuse free version.Caliper, Micrometer and Osciloscope Simulator that inside thisapp, is apps that designed based on 2D Virtual Reality concept andpurposed to be used by student or kid who will do relatedexperiment on their school's laboratory. With the visualization ofthe device as same as the real, student will not surprised when heon the real laboratory, and ready to be use the device with not toomuch to learn.To use this app, student must guided by assistant, who ever usethe real device on real laboratory. Because this app is purposed tobe used for self learning. Student or user must searching theliterature itself, and do practically by this simulator virtually,and implement what they learn in real laboratory. So assistant orteacher can participate by prepare the printable module bytheirself, and teach the student virtually by this app.Feature:-Vernier Caliper Simulator-Micrometer/Screw Gauge Simulator-Osciloscope Simulator-Dial Vernier Caliper Simulator-Depth Micrometer Simulator

Education Top Show More...

Hello English: Learn English 1158 APK
"Learn spoken English and Grammar from Hindi,Indonesian, Thai, Arabic, Malay, Urdu, Malay, Bangladeshi Bengali,Bengali, Punjabi, Telugu, Tamil, Kannada, Marathi, Gujarati, Oriya,Assamese, Malayalam, Chinese, Portuguese, Turkish and Nepali. Afree English learning course used by over 24 Million learners forspoken English, grammar, and vocabulary building.Hello English by CultureAlley is the number 1 ranked freeEducational App, and the best free App to learn English.Featured as "GOOGLE'S BEST OF 2016 APPS" and "MOST INNOVATIVE APPOF 2016" By IAMAI.Features:★ 475 Interactive Lessons: 100% free interactive lessons withconversational English, grammar topics, vocabulary and more. Alllessons work offline as well.★ Interactive Games: On reading, translation, spellings, grammar,vocabulary. With immediate results and grammar tips.★ Have discussions with teachers: Ask questions on grammar andtranslations to teachers.★ Practice using daily news: Learn with latest news, articles,audio-video clips, and e-books.★ Conversation practice game: Hold daily-use conversations byspeaking into the App - improve your spoken English skills.★ 10,000 words Dictionary: Learn new words, and hear theirpronunciation.★ Know Your Rank: Know your global and city rank.Download the free App right away to help with your dream jobinterview, or with an exam, or to impress your friends! ImproveEnglish speaking, writing, reading and comprehension, and listeningskills. Speak English with confidence!"

BYJU'S – The Learning App APK
Fall in Love with learning!Stay on top in every subject with classes from India’s bestteachers including Byju Raveendran, using state of the arttechnology for visualization. Understand and master all conceptsright from High School Foundation Class 6-12 Math & Science toCompetitive Exam Prep like JEE, AIPMT, CAT & IAS.Features:- Engaging Video Lessons: Designed by India’s Best Teachers, theseunique video class modules will give you complete understanding ofeven the most complicated concepts in such a simple way that youwill fall in love with learning. Special Modules on ICSE, CBSESample Papers for Class 7-10 students and AIPMT & IITJEEcoaching for Class 11-12 students.- For CAT Aspirants, video lectures directly from Byju and Santoshthemselves and complete test series (over 200 chapterwise tests)and 20 Full Length Mocks.-Complete syllabus coverage: The modules are planned in a way as toprovide complete coverage of all state-level Boards, ICSE and CBSEsyllabus for class 10, 9, 8 and 7. Complete IIT JEE Preparation andAIPMT Preparation for Class 11-12.- Chapter wise Tests for Class 7-12: Large collection of fulllength and topic based tests including IITJEE and AIPMT Mock Tests& ICSE and CBSE sample papers for class 10 to 7. Also practicetest based on Class 10th Question Papers for CBSE, ICSE & StateBoards.- Detailed Analysis: View detailed analysis of your progress andperformance which will help you plan even better and improve yourperformance.- Personal Mentors & Guides: Get your doubts cleared by ourmentors who are from top institutions like IIT/IIM – lay solidfoundation for IIT JEE preparation.- Adaptive Learning: Learn in a way that works best for you throughour adaptive learning modules which are designed to cater to eachstudent’s personal learning needs.With 6.5 Lakh+ likes on Facebook, we are the most liked EducationCompany on Facebook!Proven Results: Thousands of Our students have been using themobile learning and tablet training modules for CAT, IAS &IIT-JEE coaching successfully and have consistently secured topranks in all competitive exams. With a total of 87 Civil Servicesselections, 4 rank-holders in IIT top 100, a success ratio of 1 outof every 7 student getting an IIM Call and thousands of happystudents & parents, all in the launch year of this new mode oflearning itself, we have proven beyond doubt that a love forlearning can and does produce great results!!Awards that came our way- Although we don’t consider this of primeimportance, it makes us feel extremely proud that our work has beenrecognized by almost every major media house. A few notablementions are -1. CNBC TV18 Crisil Emerging India Award for Education2. Deloitte Technology Fast 50 India and Fast 500 Asia Award3. NDTV Profit Business Service Excellence Award4. ET Now Education Excellence AwardOur vision is to make learning such an enjoyable process thatstudents begin to learn not just for exams, but for life!!

CppDroid - C/C++ IDE APK
CppDroid is simple C/C++ IDE focused onlearning programming languages and libraries.Features:* code complete ** real-time diagnostics (warnings and errors) and fixes ** file and tutorial navigator (variables, methods, etc)* static analysis ** smart syntax highlighting* portrait/landscape UI* auto indentation and auto pairing (configurable)* configurable code syntax highlighting (themes) ** compile C/C++ code (no root required)* works offline (built-in compiler, no internet connectionrequired)* great C/C++ code examples included ** detailed C++ tutorial and learn guide included ** add-ons manager and auto updates* Dropbox support ** Google Drive support *On first launch CppDroid extracts SDK (about 150Mb) anddownloads and extracts examples and tutorials, so about 215Mb of internal storage space is required. It can't be moved tosd card because of android security.Start learning C and C++ by examples (menu / Project /Examples) or tutorials (menu / Project /Tutorials).App blog:http://www.cppdroid.infoAdvanced paid features (marked with *) review:http://www.cppdroid.info/p/advanced-features.htmlSee also ArduinoDroid app:http://www.arduinodroid.info

Memrise: Learn New Languages, Grammar & Vocabulary 2023.2.6.0 APK
Google Play I/O Award Winner for Best App of2017Learn how to speak like a native and unlock your foreign languagelearning superpowers with Memrise! Speak fluent Spanish, French,Japanese or Chinese and improve your grammar with easy beginner andintermediate language lessons using a fun, innovative approach fromthe free language learning app.Study new words, vocabulary and grammar with easy beginner andintermediate reading and writing lessons alongside over 15 millionpeople worldwide.Reading, writing and speaking fluent Spanish, Japanese, Chinese,Italian, French, German, Korean and other languages is easy withMemrise! Learn languages the fun way with next-generation mobilelearning, a rich variety of vocabulary and memory games, over30,000 easy-to-understand native speaker videos and interactivechatbots.Reading, writing and engaging in fluent, daily conversation is outof this world fun with Memrise!Foreign Language Learning: Top 5 Reasons to Download MemriseBeginner and intermediate Spanish, French, Japanese, Chinese,Italian and many other speaking, reading and writing foreignlanguage courses expertly created by a dedicated team oflinguistsStudy French, Spanish, Japanese (full and no script), and othervocabulary with content designed to push the boundaries of learningtechnologyStudy and learn languages with chatbots – hone a natural flow forfluent, daily conversationLearn a foreign language with native speaker videos – no actors,just real people!Vocabulary, memory and other fun language games help you learn andpractice your skills, including Difficult Words, Speed Review,Listening Skills and Classic ReviewStudy new words, beginner, intermediate and advanced vocabulary,pronunciation and practical grammar for daily conversation in yourfavorite languages including Japanese, Chinese, Korean andItalian!Study beginner Italian vocabulary for free before you fly to Romeand eat a pistachio gelato. Is Korean BBQ your favorite meal? Learnhow to order like a native speaker the next time you’re in Seoul.Check out our intermediate reading lessons and learn how to speakfluent German before donning the lederhosen for Oktoberfest.Working your way through an official Memrise course? Record andcompare your pronunciation to that of a native speaker.Memrise, the award-winning free language learning app:Google Play I/O Award Winner for Best App of 2017Editor’s ChoiceTop DeveloperBest of 2016 - Self ImprovementBest AppsFlirt in a foreign language with perfect pronunciation from memory,or impress locals with your advanced Chinese grammar knowledge thenext time you're on vacation. Got a free minute? Why not setyourself a challenge and learn two new words a day - you'll beamazed by how quickly you can pick it up! Whether it's reading inSpanish, challenging your memory skills with German articles orsimply being curious about Japanese, Memrise offers a unique andinteractive approach to the world of language learning.Learn useful, real-life foreign language skills on the go. Withpronunciation guides, beginner and intermediate courses, grammarskills and rich content, Memrise offers everything you need to havea compelling conversation in any foreign language! Download todayand start a conversation with the world around you.

Current Affairs GK - SSC IAS IBPS Exam Prep Tests 16.4.6 APK
OnlineTyari app is India's No.1 TestPreparation App for Hindi, English and Marathi medium. We providedaily updates on current affairs 2017 and GK. It contains latestonline study material for SSC (CGL, CHSL, 10+2), IBPS (Bank PO,Clerk, RRB, SBI & Associates Bank), GATE , UPSC (IAS, IPS,IES), Railways RRB, Insurance LIC AAO and state level governmentexams.Hindi and Marathi Medium SupportContent is available in Hindi (हिंदी), English and Marathi mediums.Get access to daily GK current affairs in Hindi. Improve yourGeneral Knowledge (GK) in Hindi. Get essential topics and studymaterial for GK and Current Affairs 2017, NCERT questions andsolutions, Maths (Reasoning and Aptitude), English Learning andComputer Knowledge.Daily Study and PracticeLatest daily GK current affairs notes for 2017 sent in morning withquiz. Read current affairs Weekly and Month wise. Questions andnotes provided on topics like Banking,Environment, Foreign Policyand International news. Get Job Alerts, Employment News, NewsDigest and Articles about the current happenings around theworld.Mock Tests and E-BooksSection wise and Full Length Online Mock tests are provided forexam preparation. Targeted Test series with guidance are availablefor exams like IAS, SSC, Bank PO. Solve previous years exam paperson app.OnlineTyari AIT (All India Test) allow one to check India levelrank before real exams. Detailed analysis and comparison isprovided in All India Tests.Recommended Books available in E-Book (PDF, E-pub) format. ReadBooks offline after downloading. Competition exam mock papers andE-books are available from best coaching classes of India.SSCOne app for all SSC 2016 Exams preparation. Prepare for SSC CGL,CHSL , GD Constable, Stenographer, CPO exams. Prepare for SSC inHindi Medium here. Topics for SSC like English Learning, Quant,Reasoning in app.Banking Exams (IBPS, Bank PO, SBI PO & Clerk)Single place to clear your bank exams. Daily notes, practice papersand e-books provided for Banking exams. We cover SBI PO, SBI Clerk,RBI, NABARD, SEBI, SIDBI and other bank exams. Bank specific topicslike Economy, English Tests and Banking Awareness covered.IAS (UPSC Civil Services ) 2017Crack your IAS Pre and Mains exam with help from OnlineTyari.Targeted study capsules from leading coaching like Chronicle,Vision IAS etc available. Cover your syllabus with guidance fromexperts. IAS specific topics like Ethics & Governance, Optionalpapers, Case studies available. Chapter wise Notes from NCERT forHistory, Geography, Polity subjects.GATE , IES & PSUStudy material (Mock test & E-Books) available for Engineeringbranches like Computer Science, Electrical Engineering, CivilEngineering and Mechanical. Solved previous year papers availablefor GATE & IES.Other Exams- Railways RRB and Loco pilot , insurance LIC AAO : Mock tests, MCQquestions and E-books available for Railways RRB and LIC AAOExams.- Teacher Exam: CTET, UGC NET, state level like UPTET, MPTET, REETand B.Ed exams.- Defence and police exams like CDS, NDA, IB and CRPF.- State level exams: -i) For north india we cover exams like RAS and REET (Rajasthan),UPPSC and UPTET (Uttar Pradesh), Bihar SSC and BPSC (Bihar),Haryana PSC, MPPSC (Madhya Pradesh), Maharashtra (TET, B.Ed.,Police and MPSC).ii) For south india we cover exams like Tamil Nadu PSC, Kerala PSC,Andhra PSC and Telangana PSC exams.OnlineTyari have largest network of students. Student communityallow students to ask an answer questions, seek test prepguidance.Study Material from publishers like Arihant, Jagran Josh, Chronicleand Pratiyogita Darpan available.Updates related to Application form and dates, exam pattern,syllabus , Admit cards regularly sent. Know about Examnotifications , result dates within app.Visit: https://onlinetyari.com

CBSE Class 8, 9, 10, 11 Course 2.56 APK
★★★FREE NCERT Solutions & RevisionQuestions★★★Complete CBSE classes 8th ,9th 10th and 11th study coursepowered by Everonn is available on your mobile & tab. Thisguide will help you ace your schools exams and have fun whilelearning.A very well researched course, this course contains learningcontent, animations, questions & answers, study notes, NCERTsolutions etc to help you with your school curriculum. The courseis based on the NCERT books and closely follows the syllabus forCBSE Class 8 ,9 and10 books.Each NCERT textbook chapter is explained in detail along withpractice questions and important questions that are likely to comein school exams. The course also provides detailed solutions to allthe questions present in NCERT books and has these solutionsavailable for free !The course contains detailed chapters for Class 8th, 9th, 10thand 11th -Class 8 - Science, Maths, Geography, History, Social &Political Life and English.Class 9 - Science, Maths, Geography, History, Economics, DemocraticPolicies and EnglishClass 10 - Science, Maths, Geography, History, DemocraticPolicies, Economics, Disaster Management and EnglishClass 11 - Physics, Chemistry, Maths, Biology and CommerceFor each class the course contains 2 sample chapters for eachsubject for free and the course (with access available on web also)start from INR 595For each NCERT book, all the chapters are covered in full detailalong with solutions to all NCERT questions.Also these solutions are completely FREE. So you don't need to buyextra guides for NCERT questions and answers.The content is developed by Everonn's research team inconsultation with some of the top CBSE schools in thecountry.It is a cross platform course that works across your Mobile,Tablets and Web.Visit us at http://gradestack.com/cbse to check out thecomplete course on the web.

Marbel Panduan Ramadhan + Suara APK
Bulan Ramadhan adalah bulan yang dinantikanoleh semua umat muslim di dunia. Syukur Alhamdulillah kita tinggaldi negara dengan mayoritas muslim sehingga bulan Ramadhan terasabegitu meriah dan menyenangkan. Apakah bulan Ramadhan hanya milikorang dewasa saja. Tentu saja tidak. Anak-anak pun sangat antusiasmenyambut bulan Ramadhan.Nah, bagaimana dengan buah hati anda yang masih balita?Bagaimanakah cara anda menjelaskan apa itu Bulan Ramadhan dankeutamaannya kepada sang buah hati? Mengenalkan bulan Ramadhankepada buah hati dengan cara yang menyenangkan sangatlah penting.Hal ini untuk menanamkan kepada anak-anak bahwa bulan Ramadhan itumenyenangkan.Kini telah hadir MARBEL PANDUAN PUASA RAMADHAN khusus untukanak-anak. Aplikasi ini mengajak anak-anak untuk belajar :1. Apa itu puasa?2. Apa saja keutamaan bulan Ramadhan?3. Apa saja rukun puasa?4. Apa saja amalan yang bisa dilakuakn di bulan Ramadhan?Marbel menggabungkan konsep belajar dan bermain menjadi satusehingga melahirkan cara belajar yang lebih menyenangkan. Materiakan disajikan dalam bentuk yang menarik dilengkapi dengan Gambar +Sound Narasi + Animasi untuk menarik minat anak-anak dalam belajar.Selanjutnya, mereka bisa mengasah kemampuan melalui permainanedukasi yang disediakan.Kelebihan :------------------Aplikasi ini dilengkapi dengan gambar dan ilustrasi serta animasiyang menarik, sehingga anak-anak akan merasa tertarik untukbelajar. Setiap materi dilengkapi dengan narasi pendukung. Aplikasiini dilengkapi juga dengan doa berbuka puasa, niat berpuasa sertaniat shalat tarawih lengkap dengan voice narasi, tulisan dalamhuruf arab dan latin, serta artinya dalam bahasa Indonesia.TENTANG MARBEL--------------------------------------------------Marbel adalah aplikasi pendidkan khusus untuk anak-anak usia 2 s/d8 tahun. Bersama Marbel, anak-anak bisa belajar banyak hal dengancara yang menyenangkan. Tersedia materi pembelajaran yang akanmembantu anak-anak dalam belajar mengenal sesuatu misalnya sajahuruf, angka, buah, sayur, hewat, alat-alat transpotasi, warna, danmasih banyak lainnya. Yang paling menarik dari marbel adalah :Permainan edukasi yang menyenangkan. Ada berbagai macam permainanyang akan menguji kemampuan mereka. Permainan itu terdiri dari :tepat cepat, ketangkasan, daya ingat, kecerdikan, asah otak danmasih banyak lainnya. Marbel dilengkapi dengan gambar dan animasiyang menarik, musik orisinil, serta narasi panduan yang bergunabagi anak-anak yang belum lancar membaca.Kami mengharapkan kritik dan saran dari anda, jangan ragu untukmengirimkannya ke :[email protected] lebih lanjut mengenai Marbel:Website: www.educastudio.comFacebook: www.facebook.com/educastudioTwitter: @educastudioBagi bunda yang suka menemani anak-anak bermain, tak ada salahnyamencoba aplikasi Marbel. Anak-anak tak hanya mendapatkan kesenangandalam bermain, namun juga ilmu yang bermanfaat. Belajar sambilbermain..?? Kenapa tidak..?? Ayoo kita temani anak-anak belajar,bersama Marbel tentunya.. :)The month of Ramadan is amonth that is eagerly anticipated by all Muslims in the world.Praise to God we live in a country with a Muslim majority thatRamadan was so festive and fun. Is Ramadan belong only to adultsonly. Of course not. The children were very excited to welcome themonth of Ramadan.Well, what about your baby are still toddlers? How can you explainwhat it was the month of Ramadan and its primacy to the baby?Introduce the month of Ramadan to the baby in a fun way is veryimportant. It is to instill in children that Ramadan was fun.Now has come Marbel RAMADAN FAST GUIDE specifically for children.This application invites children to learn:1. What is fasting?2. What are the virtues of Ramadan?3. What are the pillars of fasting?4. What can dilakuakn deeds in Ramadan?Marbel combines the concept of learning and playing into one thatgave birth to a way of learning more enjoyable. The material willbe presented in an attractive form comes with Image + SoundNarrative + animations to attract children's interest in learning.Furthermore, they can hone skills through educational gamesprovided.Advantages :------------------The application comes with pictures and illustrations andinteresting animation, so the children will feel interested inlearning. Each material is equipped with a supporting narrative.This application is also equipped with a prayer iftar, theintention of fasting and of prayer tarawih complete with voicenarration, written in Arabic and Latin letters, as well as itsmeaning in Indonesian.ABOUT Marbel--------------------------------------------------Marbel is a special education application for children ages 2 s / d8 years. Together Marbel, children can learn a lot of things in afun way. There are learning materials that will help children tolearn about something for example only letters, numbers, fruits,vegetables, Hewat, means of transportation, color, and many more.The most interesting of the marble is: a fun educational game.There is a wide variety of games that will test their skills. Thegame consist of: a fast right, dexterity, memory, ingenuity, brainteasers and many more. Marbel equipped with interesting images andanimations, original music, and narrative useful guide for childrenwho are not yet fluent reading.We expect criticism and suggestions from you, please do nothesitate to send it to:[email protected] information about Marbel:Website: www.educastudio.comFacebook: www.facebook.com/educastudioTwitter:educastudioFor mothers who like to accompany the children to play, there's noharm in trying the application Marbel. Children not only have funin the play, but also useful knowledge. Learn while playing .. ??Why not..?? Ayoo we accompany the children to learn, along Marbelcourse .. :)

Daily Current Affairs & GK APK
Daily GK Current Affairs: Weekly GK, MonthlyGk Digest in English and Hindi (off line too)2017 GK One-liners, Banking GK, Speed tests SSC CGL 1, SBI, IBPSupdate in English-HindiPrevious papers PDF, Exam pattern, Mock, Speed testsSyllabus, Short tricks, Study Notes, Video LecturesNew Jobs, vacancies notificationMock Speed Sample Test SeriesEnglish essay, letter writing practice in feedback and correctionto score better in descriptive section of SBI, insuranceDiscussion ForumVideo Notes, topic wise short tricks video class tutoriallectures2017 Hindi, English Daily GK, Banking Awareness questions, English,Static GK - history, geography, Computer as sample paper, based onprevious papers, Revise offline in the app. Exam Covered:1. IBPS - PO, Clerk, RRB2. SBI: PO - Clerk3. SSC - CGL 1, 2 , CHSL4. CTET, Insurance, LIC, NICL5. CSAT, CALT, BBA6. RailwaysSubjects Section: Daily Current AffairsAll material - short notes, daily questions, video lectures,puzzles, D.IMaths, reasoning questions with shortcut explanation, tricks.Questions are good for SSC CGL Tier 1 and UPSC. As GK generalstudies is also an integral part of CLAT, AAO, which means we coverall the main events of the day which make into the daily news aresimply ideal for those exams as well and its result is a tells youabout your preparation. Now regularly providing English questions,covering topics like synonyms and antonyms, para jumbles, spottingerrors, sentence improvements, new pattern questions and shortlearning tricks for vocabulary.Sports, economy, state news, national, international politics andtake old papers, 10 years and previous exam pattern intoconsideration. Besides a majority of questions some are speciallyof business GK and economics. As we understand that Banking termsknowledge is an important aspect of Bank PO and specialistofficers' exam. Questions are also helpful for state officers bankexams like cooperative bank, SIDBI and SEBI. App is also for NDA,CDS, LAW, Delhi Police SI, Data Entry operators or LDC.As the name of the App says, daily current affairs, means weprepare questions daily as per the latest pattern. Yes, each day ofthe year you will find some of the best and important questionsthat will help you in your exam preparation. Which means that eachday you will get latest daily current affairs. The language ofquestions is so simple that even students from Hindi medium willfind it very easy to understand and now a lot of questions andstudy notes are available in Hindi as well.1. 50 questions daily in the form of mock quiz based on latest 2017exam syllabus.2. Model paper questions answer for online exams mock test.3. Check your performance on daily basis as you take one All IndiaMock Tests.4. Questions and answer in the multiple choice format, as itappears in previous year competitive exams like RRB5 Also take section test to improve your speed in reasoning, mathsEnglish, static Gk and computer knowledge.In this GK app would be giving you 50 current affairs question eachday, which means that within one month you will have nearly 1500current affairs, English, maths, reasoning, computer knowledge,banking. And if you practice regularly then within a couple ofmonths you will have close to 3000 GK questions and these questionswill help you in any online exam of bank specialist, DMRC CRA or SIand ASI in Police Forces and even CISF . Now questions are tuned infor railways exam as well. It is a perfect e-learning competitiveeducation app for your online study needs.Please ensure that you attempt full-length CWE GA sample paper. Wehave been adding mock sample paper questions as per new pattern ofStatic GK, history, geography, science constitution, science.* Now offering Speed test and Free All India Test for all examsWith all India rank for English, Reasoning, maths bankingawareness, computer awareness.https://www.facebook.com/instockcom/