

Description
App Information SILget
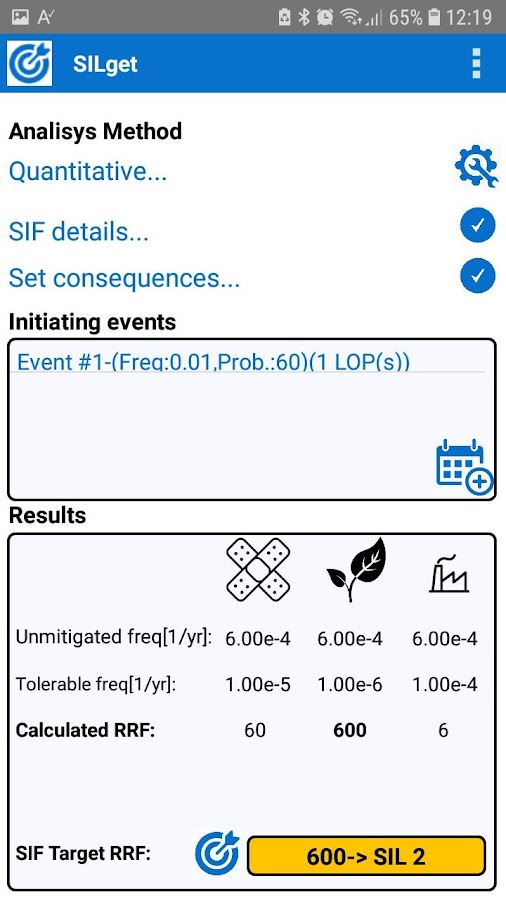
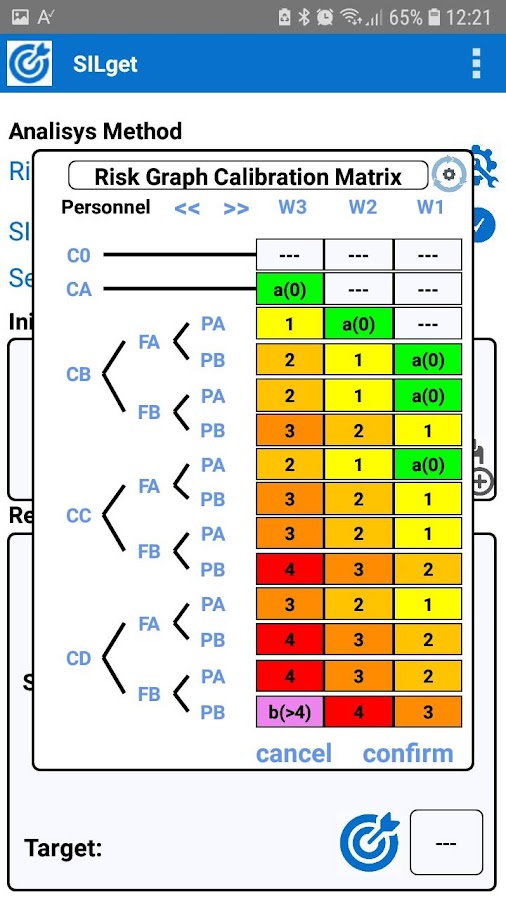
- App NameSILget
- Package Nameapp.GigioSoft.SILGet
- UpdatedDec 24, 2018
- File SizeUndefined
- Requires AndroidAndroid 2.0
- Version1.0.0
- DeveloperGigioSoft
- Installs-
- PriceFree
- Category
- Developer
- Google Play Link
GigioSoft Show More...


Similar Apps Show More...


BITZER REFRIGERANT RULER 3.3.0 APK
The BITZER REFRIGERANT RULER enables easy and fast determinationofrefrigerant data. The app contains all commonrefrigerants,including key fluid properties, safety groupinformation, globalwarming potential (GWP), ozone depletionpotential (ODP), andinformation on choice of oil type for thecompressor. Furthermore,additional information on refrigerants,links to relevant onlinedocuments and other information aredisplayed (under "More..." inthe menu bar). The tool provides anintuitive user interface foreasy and accuratetemperature-to-pressure conversion, whileallowing easy use andswitching between different metric (SI) andimperial (IP) units(under "Settings"). // CURRENTLY AVAILABLEREFRIGERANTS // ▸ The appcontains data and information on morethan 100 natural and syntheticrefrigerants, which can also bepreselected by filter functions(under "Search"). ▸ For comparisonpurposes and also for practicaluse in service and operation ofolder existing systems, informationon previously usedrefrigerants, which may have been affected byusage restrictions,are also provided. // MAIN FUNCTIONS // ▸ Searchfilters andfavourites: Under the navigation item "Search" or viapredetermined"Search filters" or manual entry in the text field theappropriaterefrigerant can be found and, if necessary, added to thefavouritesby tapping the "star symbol". With a simple touch on theselectedrefrigerant, the slider for the pressure-temperatureconversion isdisplayed. ▸ Ruler: By means of a slider, the valuesof pressure,dew and boiling (bubble) temperatures (temperatureglide resultingfrom the difference) for the selected refrigerantcan bedetermined. Pressure and temperature values can also beenteredmanually - either by tapping on the respective field or viathesymbol "123". When installing the app overpressure valuesarepreset. With this setting, the atmospheric pressure can beenteredeither manually on the upper ruler or via the "barometersymbol" tocorrect the pressure values. A change to absolutepressure valuesis possible under "Settings", the atmosphericpressure correctionis then inactive. Further function: By tappingon the refrigerantname, direct access to "Search" (refrigerant listand searchfilters) is also possible. ▸ Settings: Under this menuallimportant parameters for the determination of theatmosphericpressure as well as for temperature and pressure valuescan beadjusted. Other functions allow for a change to defaultsettingsand a repeated display of the “Tutorials” in the rulerview. ▸Automatic Barometer: The app offers the possibility todeterminethe current altitude above sea level and/or the actualatmosphericpressure to correct the corresponding dew and bubbletemperaturesin case of overpressure settings. Depending on theconfiguration,the analysis for the location in question isoptionally carried outautomatically via GPS or barometer if thecorresponding terminalhas the aforementioned sensors. Manuallyentering the atmosphericpressure or correction is possible asdescribed under “Slidercontrol”. ▸ Temperature / pressure:Temperature and pressure unitscan be freely selected and combined,if necessary, a mix of SI andIP units is possible as well. Foroverpressure (or negativepressure) bar (g) or psig / inHg can beselected. In the Settingpsig / inHg displays the overpressurevalues in "psig" and thenegative pressure values in "negative inHg"(e.g., -7.5 inHg). ▸Further information on refrigerants: Generaland additionalinformation can be found under the information symbol"i" in theheader next to the refrigerant name. These include, forexample,GWP and ODP values for the refrigerants, safety group,chemicalcomposition or components in mixtures, CAS number,molecularweight, triple and boiling (bubble) points, criticaltemperature,critical pressure and information on the type of oilfor thecompressor.


Energy Consumption Analyzer APK
This application keeps track of your energyconsumption. Add your meters for gas, electricity, or water to thedatabase and record the current meter readings from time to time.Readings can be color-coded and comments may be added to rememberspecial situations which may explain unusual energy usage. Aregular reading interval is not required, take a reading wheneverit is convenient.From the entered data, the application calculates the averagenormalized rate of consumption per hour, day, week, or month(bewteen two readings) and draws a graph showing the consumptionrate over time. The total amount of actually used energy duringeach day, week, month, or quarter is displayed as a bar graph ortable. If the average cost per unit is provided, the graphs canalso show the amount of money instead of energy.For CLOUD SYNC: Use Export/Import via Google Drive to exchangedatabase contents with other devices.Meter exchange or reset is detected automatically and consumptiondata is recorded seamlessly across the reset.Pinch zoom can be used on the trend and bar graph pages. Inlandscape orientation, comments are displayed in the listview.Indirect metering is supoorted. In this case, the meter value ismultiplied with a certain factor to convert it to the final energyvalue. Two separate unit texts can be entered, one for the meterand one for the actual energy value.Meters can be marked to count backwards, which can happen withprepaid meters, showing the amount of remaining prepaid energyinstead of used energy.Virtual meters can be used to display the sum of individual metersand do simple unit conversion, for example from m3 to kWh. Pleasenote that you should read your physical meters which are part of avirtual meter all around the same time for best results.Meter data can be imported from and exported to CSV files from thecontext menu of each meter (long-press on the meter entry). Meterscan also be edited and deleted via this context menu.In addition to meter readings, sensor data like temperature or windspeed can be recorded. At the moment, this data is shownseparately, but may be shown in combination with meter data infuture releases.ECAS is currently available in the following languages:English, German, Japanese: Maintained by developer.Czech: Provided by ONovyDanish: Provided by KimDutch: Provided by GerardFrench: Provided by BernardHungarian: Provided by PeterItalian: Provided by SDSPolish: Provided by Sławomir SochRomanian: Provided by LucianRussian: Provided by NikolaiSlovak: Provided by SilvioSlovenian: Provided by TomiSpanish: Provided by JavierSwedish: Provided by LarsTurkish: Provided by SuphiUkrainian: Provided by SergiiWant to run ECAS in your own language? Visit the ECAS website andcheck out the translation page!IMPORTANT NOTE: The trend graph does NOT show total amount ofenergy used. The bar graph is used for this information. The trendgraph shows usage values normalized to a certain time period(hour/day/week/month or year). If your meter records a usage of10kWh within one hour (10kW power), the trend will show a usagerate of 240kWh per day for that measurement point (10kWh/h = 10kWpower rating, normalized to one day -> 10kW * 24h = 240kWh).This is by design.In case of questions or bug reports, please check the website (FAQsection) or send me an email.


