
Description
App Information BIAL Foundation 12
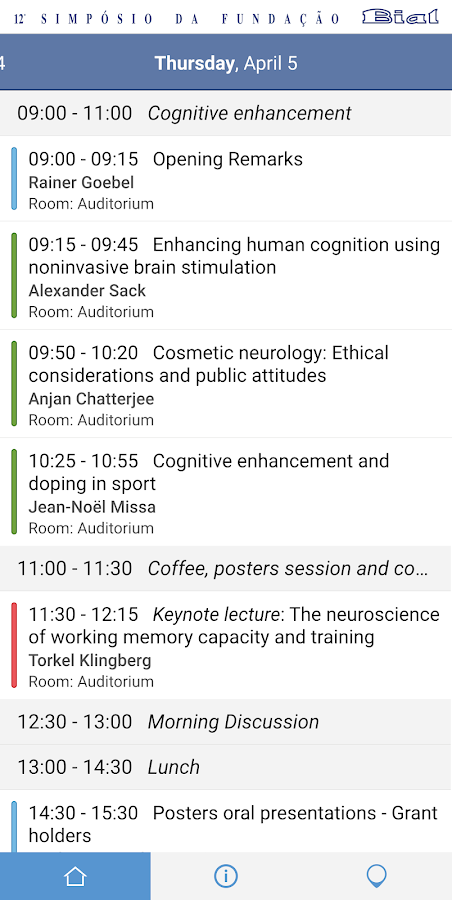
- App NameBIAL Foundation 12
- Package Namecom.braininnovation.BIAL12
- UpdatedMar 28, 2018
- File SizeUndefined
- Requires AndroidAndroid 5.0
- Version1.0
- DeveloperRainer Goebel, Brain Innovation
- Installs-
- PriceFree
- Category
- DeveloperHoogbosch 2 6228SH Maastricht The Netherlands
- Google Play Link
Rainer Goebel, Brain Innovation Show More...


Similar Apps Show More...


T2 Mood Tracker APK
T2 Mood Tracker is designed to help you trackyour emotional experience over time and to provide you with a toolto share this information with your health care provider.This app comes with six pre-loaded issues: anxiety, depression,general well-being, head injury, post-traumatic stress, and stress.You can also add customized scales on any topic (e.g., a painscale). You use simple sliders to rate yourself on these behavioralcategories and the app automatically graphs your inputs. You canalso make notes describing things that happened during the day thatmay have affected your moods. This provides you and your healthcare provider with a complete tool to help you uncover patterns inhow you are feeling. It may also help you to evaluate the impact ofdaily events or the effects of treatment on your mood.T2 Mood Tracker was developed by the National Center for Telehealth& Technology (T2), the Defense Department’s primary agency forapplying innovative technology to issues of psychological healthand traumatic brain injury• Report generator makes sharing results simple! Generate PDF orCSV reports to print or email to your health care provider.• Backup database saves all your data on the SD card. Easily moveyour T2 Mood Tracker results to a new phone or save a backupoff-phone, so you don’t lose your data if you lose yourphone.• Locate psychological health support in your area via the OutreachCenter link.• Program the reminder to update your moods as often as you like -weekly to several times a day.• Pre-loaded with six common issues. Customize with ANY feeling orissue you want to track.• Results display in easy to read color graphs with pinch zoom,customizable symbols, and options to display as much or as littledata you desire.


