


Description
App Information Energy Consumption Analyzer
- App NameEnergy Consumption Analyzer
- Package Nameat.topfen.ecas
- UpdatedApril 30, 2017
- File SizeUndefined
- Requires AndroidAndroid Varies with device
- Version
- DeveloperChristoph Zens
- Installs100,000 - 500,000
- PriceFree
- CategoryTools
- Developer
- Google Play Link
Energy Consumption Analyzer Version History
Select Energy Consumption Analyzer Version :-
Energy Consumption Analyzer 3.2.4 APK File
Publish Date: 2017 /6/7Requires Android: Android 5.0+ (Lollipop, API: 21)File Size: 1.1 MBTested on: Android 6.0 (Marshmallow, API: 23)File Sha1: 260a5566444e1fa2087828326e00e14024b86035 -
Energy Consumption Analyzer 2.4.6 APK File
Publish Date: 2016 /2/11Requires Android: Android 2.1+ (clair, API: 7)File Size: 413.2 kBTested on: Android 2.3.3 (Gingerbread, API: 10)File Sha1: e062c6bb6a5092a4a87191decef4175a30c4f1ad
Christoph Zens Show More...

Energy Consumption Analyzer APK
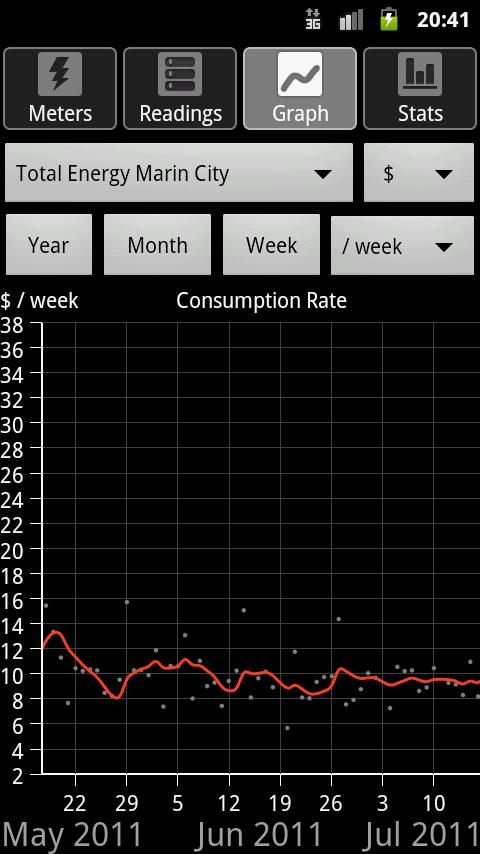
This application keeps track of your energyconsumption. Add your meters for gas, electricity, or water to thedatabase and record the current meter readings from time to time.Readings can be color-coded and comments may be added to rememberspecial situations which may explain unusual energy usage. Aregular reading interval is not required, take a reading wheneverit is convenient.From the entered data, the application calculates the averagenormalized rate of consumption per hour, day, week, or month(bewteen two readings) and draws a graph showing the consumptionrate over time. The total amount of actually used energy duringeach day, week, month, or quarter is displayed as a bar graph ortable. If the average cost per unit is provided, the graphs canalso show the amount of money instead of energy.For CLOUD SYNC: Use Export/Import via Google Drive to exchangedatabase contents with other devices.Meter exchange or reset is detected automatically and consumptiondata is recorded seamlessly across the reset.Pinch zoom can be used on the trend and bar graph pages. Inlandscape orientation, comments are displayed in the listview.Indirect metering is supoorted. In this case, the meter value ismultiplied with a certain factor to convert it to the final energyvalue. Two separate unit texts can be entered, one for the meterand one for the actual energy value.Meters can be marked to count backwards, which can happen withprepaid meters, showing the amount of remaining prepaid energyinstead of used energy.Virtual meters can be used to display the sum of individual metersand do simple unit conversion, for example from m3 to kWh. Pleasenote that you should read your physical meters which are part of avirtual meter all around the same time for best results.Meter data can be imported from and exported to CSV files from thecontext menu of each meter (long-press on the meter entry). Meterscan also be edited and deleted via this context menu.In addition to meter readings, sensor data like temperature or windspeed can be recorded. At the moment, this data is shownseparately, but may be shown in combination with meter data infuture releases.ECAS is currently available in the following languages:English, German, Japanese: Maintained by developer.Czech: Provided by ONovyDanish: Provided by KimDutch: Provided by GerardFrench: Provided by BernardHungarian: Provided by PeterItalian: Provided by SDSPolish: Provided by Sławomir SochRomanian: Provided by LucianRussian: Provided by NikolaiSlovak: Provided by SilvioSlovenian: Provided by TomiSpanish: Provided by JavierSwedish: Provided by LarsTurkish: Provided by SuphiUkrainian: Provided by SergiiWant to run ECAS in your own language? Visit the ECAS website andcheck out the translation page!IMPORTANT NOTE: The trend graph does NOT show total amount ofenergy used. The bar graph is used for this information. The trendgraph shows usage values normalized to a certain time period(hour/day/week/month or year). If your meter records a usage of10kWh within one hour (10kW power), the trend will show a usagerate of 240kWh per day for that measurement point (10kWh/h = 10kWpower rating, normalized to one day -> 10kW * 24h = 240kWh).This is by design.In case of questions or bug reports, please check the website (FAQsection) or send me an email.
Similar Apps Show More...


Strom-Check 2.7 APK
Gelbes genau im Blick.Auch ohne intelligenten Sparzähler online zu jeder Zeit beimStromverbrauch voll durchblicken: Mit dem neuen kostenlosenStrom-Check von Yello Strom wissen Sie immer, wie viel Strom beiIhnen fließt – egal, ob Sie Yello Strom Kunde sind oder nicht.Einfach kurz Zähler ablesen, sofort in die App eingeben und direktden eigenen Stromverbrauch sehen. Bestimmen Sie selbst, wie oft Sieden Gang zum Zähler antreten und wie genau Sie Ihren Stromverbrauchim Blick behalten wollen. Ob nach dem Partywochenende oder demUrlaub – schneller Check mit dem Strom-Check. Wenn Sie möchten,jeden Tag!Zettel und Stift waren gestern.Nehmen Sie einfach Ihr Smartphone mit zum Stromzähler und gebenSie Ihren Zählerstand direkt und bequem ein. Der Strom-Checkspeichert und archiviert alle eingegebenen Zählerstände für Sie undsogar noch mehr: sofort erhalten Sie eine grafische Auswertung überIhren aktuellen Stromverbrauch. Somit haben Sie Ihr Stromverhaltenauch langfristig im Auge.Voll Durchblicken.Sympathische Beispiele aus dem Alltag schlüsseln die Maßeinheit‚kWh‘ auf und sorgen für ein schnelles Verständnis Ihres eigenenVerbrauchs. Bei regelmäßiger Anwendung entsteht so ein sicheresGefühl für Ihren Gesamtverbrauch sowie Ihren durchschnittlichenTagesverbrauch.Strom-Check steckt an.Hochspannung mit dem Strom-Check – viele Zusatzfeatures erwartenSie:√ Verbrauchsvergleiche aus dem Alltag.√ Möglichkeit des Teilens in sozialen Netzwerken, wie Facebook undTwitter.√ Taschenlampen-Funktion.√ Zählerstands-Ablesung als Termin im Google-Kalender.√ Erinnerungs-/Alarmfunktion zu eingetragenenAblese-Terminen.Für Yello-Kunden bietet die App zusätzliche Vorteile:√ Export und Import von Zählerständen zu Mein Yello.√ Import der persönlichen Zählernummer aus Mein Yello.Gehen Sie auf mobile Entdeckungsreise in Ihrer persönlichengelben Welt.Wir wünschen Ihnen viel Spaß dabei und freuen unsselbstverständlich immer über Ihre Meinung. Wenn Sie Feedback,Fragen oder Anregungen haben, schreiben Sie uns einfach eine E-Mailan [email protected]. Wirsind jederzeit gern für Sie da!Yellow close eye.Fully hinted Even without intelligent Sparzähler online at anytime in power consumption: with the new free-flow check of YelloStrom, you always know how much electricity flows in you - whetheryou are Yello Strom customer or not. Just read short counter, enterimmediately into the app directly and see their own electricityconsumption. You decide how often you take a trip to the counterand how exactly you want to keep your power consumption in view.Whether after party weekend or vacation - fast check with thecurrent check. If you want, every day!Pen and paper were yesterday.Just take your smartphone with electricity meters and enter yourmeter reading directly and conveniently one. The current checkstores and archives all entered meter readings for you and evenmore: once you obtain a graphical analysis of your current powerconsumption. Thus you have your current behavior in the long termin mind.Full vistas.Sympathetic examples from everyday life break the unit, kWh 'andprovide a rapid understanding of your own consumption. With regularuse, the result is a feeling of security for your overallconsumption as well as your average daily consumption.Current check is contagious.High voltage to the power check - many additional features youexpect:√ consumption comparisons from everyday life.√ possibility of sharing in social networks, like Facebook andTwitter.√ Flashlight function.√ count reading as an appointment in Google Calendar.√ Erinnerungs-/Alarmfunktion to registered meter readingdates. For Yello customers, the app offers additional benefits:√ Export and import of meter readings to My Yello.√ Import of personal counter number from My Yello.Go to mobile journey of discovery into your personal yellowworld.We wish you lots of fun and look forward, of course, always onyour mind. If you have any feedback, questions or suggestions,please write us an e-mail to [email protected]. We are alwayshappy to help!

Electricity Usage Calculator 1.0 APK
Electricity Usage Calculator helps you to track your MonthlyElectricity Usage. Real time rates of different states andelectricity boards of India and other countries. Check Electricityrates of your supplier. Set Daily reminder to Switch off the lightand devices. Set Monthly Electricity Bill payment reminder.


App Analyzer 1.13.2 APK
App Analyzer helps you better monitor, manage, analyze your appsinstalled on Android devices. Main Features: 1. Checking outinstalled apps list including system apps using ListView andGridView 2. Browsing App Detailed Information - App name - Packagename - Version - Size - Install Date - Last Updated Date - TargetSDK Version - Data Path - Required Permission 3. ViewAndroidManifest.xml 4. Extract APK files 5. Sort Apps based on anApp name, the first installed date and the last updated date. 6.Uninstalled App list that you removed in the past 7. App NameSearch 8. Run, Share or Rate Installed Apps 9. View device'sresource qualifiers 10. App Settings If you have any issues orfeedbacks, please tell us about the issue by email. Key words:developer tools, app analyzer, app manager; task manager;

Power Consumption Calculator 3.1 APK
With this app you can easily calculatetheconsumption and the total cost of your devices.You can customize the power of your device, the number ofhoursand days, the number of devices and the cost per unit(hour).Now, you can set a limit and you see when the limit willbereached.FEATURES:- set the power of your device- set the number of hours per day- set the number of days- set the cost per unit (hour)- configure a limit- activate or deactivate the limit- Multilanguage (german and english, automatically set dependsonyour system configuration)Please report bugs or wishes you want in upcoming versionsandplease rate this app in the PlayStore.Thanks!
Tools Top Show More...


NetLoop VPN 5.0.4 APK
NetLoop is formerlyknownasSimpleAndroid ServerThis app contains a Proxy Server and aFreeVPN.The VPN is not a full featured VPN. it is notprovidedforsecuritybut for tunneling purposes.if you are using NetLoop's proxy serveroptionpleasemakeremove any existing proxy server address inyourdevice'sAPNsettings. Failure to do this will cause Some ofyourapps not togothrough the VPNVPN features:• HTTP request Compression.•Ability to modify TCP connection parameters.• Ability to use hotspot over VPN ( Requires root )•Ability to use multiple concurrent connections to theVPNserversforthe best Network usage experienceLocal server features:•modify outgoing requests.•specify alternate proxy servers to send a request through•provide alternate headers and ability to stripheadersfromincominghttp responses•ability to choose number of connections to be maintainedbytheapp(good for power management)•ability to share configurations throughanyfiletransfermethod.•System wide proxy serviceif you are to use this app with the proxyserverfeature,makesure that the device's proxy serverfeatureisdisabled:.to use a received config.json fileasthecurrentsetting:•locate the received file using any file manager ofyourchoice•open the share menu of the file manager and select"usefileasconfig"OR•Launch NetLoop and use Load ConfigThe Profiles Feature lets youeasilyswitchbetweenconfigurations when using NetLoopEnjoy!!.

FREE WiFi Password Recovery 4.3 APK
Need to re-connect your new device to WiFinetwork, but forgot your password? Want to share a WiFi password ofrandom characters with your friend?Use FREE Wifi Password Recovery to backup all WiFi passwords onyour device, and restore it when you need them with just one click!Share with friends through SMS or email. Yes, just that easy!FREE Wifi Password Recovery features:■ LIST, BACKUP & RESTORE all network's (WiFi) password savedon your device!■ Show SSID and Password on fullscreen (for easy viewing andsharing with others)■ Copy WiFi Password to Clipboard (to be able to pasteanywhere)■ Show QR Code (to another device scan and access thenetwork)■ Share password through SMS or EmailPlease Note that FREE Wifi Password Recovery:① only works on rooted devices (needs super-userpermissions).② is not a WiFi password cracker. NOT intended to crack WiFinetworks.③ needs previous access to WiFi networks with your device toretrieve passwords.❐ Please understand that FREE Wifi Password Recovery is a freeapp and contains ads to support develop cost. For ads free app, wehave a paid version - check out in Play Store:http://goo.gl/elnAHS❐ Why FREE Wifi Password Recovery only works on a rooteddevice?Because your device stores WiFi passwords when you connect to a newWiFi network. You are not able to access the passwords and retrievethem unless you have super-user permissions. Checkout here for moreinformation on root: http://www.androidcentral.com/root❐ Please don’t hesitate to contact([email protected]) for any issues you may have; and dogive us 5 stars if you like us! Thanks & enjoy!

XAPK Installer 1.4 APK
Say goodbye to Android APK OBB Installing error problem, XAPKInstaller makes that easier and faster than ever.• Scan and preview all .apk file on your phone and SD Card• Delete or install APK, XAPK ( APK with cache data or obb file)automatically• Download XAPK, APK free online with your Android phone andtabletXAPK Installer for PC is available that allows you to install.apk files from Windows XP, Vista, 7, 8. 8.1 to Android devices.Learn More: http://apkpure.com/apk-install.htmProblems downloading or installing APK with XAPK Installer? Seehttp://apkpure.com/xapk.htmStill need more help? Please tell us more about the issue onFacebook. https://www.facebook.com/apkpure

ENGIE - Convivium APK
Convivium, l’applicazione ENGIE pensata per semplificare la vitanelcondominio! Convivium gestiste, per l’amministratore e icondòmini:• SEGNALAZIONI TECNICHE: facilita la gestione dellerichieste diintervento, aggiornando i condòmini e l’amministratorein temporeale sullo stato di avanzamento • MESSAGGIAMMINISTRATORE:semplifica la comunicazione tra condomino eamministratore suscadenze, assemblee e molto altro • ARCHIVIODOCUMENTI: raccoglie idocumenti importanti del condominio, comeverbali e preventivi •CONTATTI UTILI: gestisce la rubrica con icontattidell’amministratore, dei condòmini e dei fornitori delcondominio,come l’idraulico e l’elettricista • BACHECA SOCIAL:crea unacommunity tra i condòmini per scambiare informazioni eavvisi utiliL’applicazione è dedicata agli amministratori chegestisconocondomini clienti ENGIE e a tutti i loro condòmini.ACCESSOCONDÒMINI: per accedere è necessario seguire la proceduradiregistrazione condòmino, indicando come codice condominio ilCodiceFiscale del condominio ACCESSO AMMINISTRATORI: per accedereènecessario utilizzare le credenziali impostate per lapiattaformaweb Si segnala che la grafica e la navigabilità dell’appConviviumsono ottimizzate per la navigazione da smartphone. Ituoisuggerimenti e le tue segnalazioni sono importanti per noi.Perqualsiasi necessità puoi chiedere supporto scrivendoall’indirizzoemail [email protected], saremo felici diaiutarti.

360 Security -Free Antivirus,Booster,Space Cleaner APK
Free Security Protection, Speed Booster andJunk Cleaner for Android PhoneTrusted by 200 million users, 360 Security is the #1 all-in-onepower cleaner, smart speed booster and antivirus app that optimizesyour background apps, memory storage, junk files & batterypower, keeping your device safe from virus and trojan.Download this powerful super cleaner master optimization &security app that’s intuitively designed to protect your mobilelifestyle in just ONE tap, making phones run like they're brand newall the time.Why 360 Security is a MUST-HAVE app?★It’s an Effective Speed Booster & Smart Cleaner-Lacking spacefor new apps and photos? Just clean app caches and junk files,boost your phone with ONE click!★It’s a Smart Battery Saver- Battery draining quicker than ever?Kill redundant apps that drain your battery and extends batterylife!★It’s a Virus Remover for android -Worried about viruses orphishing? 360 Security’s top antivirus solution makes sure yourdevice is free from malware, vulnerabilities, adware andTrojans!------------------------------------------Highlights of 360 Security►Security & AntivirusScan installed apps, memory card content and new appsautomatically. 360 Security’s latest protection technologiesagainst viruses, adware, malware, trojan and more.►Junk File CleanerDelete all types of junk files (system cache, image cache, videocache and advertisement cache) to free up the storage space.►Speed BoosterBoost speed to improve the performance and RAM of your phone, boostyour games to make them run smoothly.►CPU Cooler MasterIntelligently saves your device’s power by knowing when toautomatically trigger 360 Security’s Battery Saver feature and makeyour phone stay with durable power and never overheated.►Anti-theftAn all-in-one anti-theft solution, should you lose your belovedphone. A suite of features including, Erase, Locate, Alarm &Lock can assist you with retrieving the lost device and protectingpersonal data. You can trigger remote features via our webinterface at http://findphone.360safe.com►PrivacyPrivacy & App Lock – Prevent data on the device such asFacebook, Instagram, Whatsapp, Snapchat, photo albums and otherimportant & private documents from falling into the wronghands.►Intruder SelfieInstantly snap a photo of anyone who breaking into your apps andrecord the date & time in App Lock for check.►Fingerprint LockUnlock screen quickly and easily with your fingerprint if yourdevice has the fingerprint sensor, no fear of forgetting pattern orPIN code any more.►Real time protectionScan installed apps & local APK files and also monitor eachinstallation process, provide the best payment & shoppingsecurity.Protect your mobile device with 360 Security, a top of the linefree security app designed to protect your Android phone againstthe latest virus, malware, system vulnerabilities & privacyrisks. This super speed cleaner also clears application caches andjunk files from your system, increases the available storage spaceon SD card and boosts your Android phone for free.------------------------------------------360 Security is available more than 35 languages: English,Português(Brasil), Português(Portugal), Español(España),Español(Latinoamérica), Pусский, हिन्दी, ไทย, Bahasa Indonesia,Türkçe, Tiếng Việt, 中文(简体), 中文(繁體), Bahasa Melayu, 日本語, Deutsch,Français, 한국어, Italiano, Čeština, Nederlands, Svenska, Polski,Suomi, Română, Ελληνικά, Magyar, Hrvatski, Dansk, العربية, हिन्दी(भारत), Filipino / Tagalog, فارسی, Українська, Lietuvių (Lietuva),Slovenščina (Slovenija), Norsk, ភាសាខ្មែរ (កម្ពុជា), اردو زبان,etc.► Read in app permissions and usage here: ►http://goo.gl/3a2mCdWe would like to hear from you:Like us on Facebook:https://www.facebook.com/360safecenterJoin us on Google Plus Community:https://plus.google.com/communities/109670671299307805270

Undeleter Recover Files & Data 5.0 APK
Scan for and recover deleted files from memorycards and internal storage on rooted* devices.Without a jailbreak/root* access, Undeleter can only scan appcaches for images. READ BELOW FOR INFO ABOUT ROOT.For free, the app will restore all supported image file typesand all types of data, including SMS, call logs and WhatsApp orViber conversations. It will also shred and secure delete.Unlock it to recover other supported file types, remove ads andenable background scanning.*ROOT/SUPERUSER PERMISSIONS require that you modify theoperating system on your device, visit this website for moreinformation: http://www.androidcentral.com/rootApp caches can contain images that would not otherwise bediscoverable: you may find photos that were shared with you onsocial media but you never opened, or lower quality copies ofimages you have now or have deleted in the past. They may alsocontain images that have been preloaded by your browser or otherapps on your device - even images of people you don't know. Theycan be filtered out using "Hide extant files".File types: Journal scanning can discover files with anyconceivable extension. Essentially these files are still on yourvolume with their data in allocated sectors. Journal scan is onlyavailable on EXT4 and derived file systems.Deep scan heuristically scans for and recovers the following typesof files: BMP, JPEG/JPG, PNG, MNG, JNG, GIF, MP4, AVI, MKV, MP3,OGG, OGM, WAV, FLAC, AMR, MP4A, PDF, SXD, SXI, SXC, SXW, ODT, ODG,ODS, ODP, DOCX, XLSX, PPTX, ZIP, JAR, APK, EPUB.Data scanning is available for a select number of apps, includingthe system phone and SMS applications. Data will be recovered inthe form or HTML files for WhatsApp and Viber, as we cannot mergethird-party catalogs.Shred/secure delete: Files found on free disk areas can be erasedpermanently in bulk using the Shred function. You can also use thesystem-wide Share menu to securely erase files directly through anyother app, for example by opening the gallery, selecting a numberof images, pressing the Share button and selecting Securedelete.ACCOUNT - needed for Google Drive and Dropbox uploadCALL/SMS - needed for app data scanner - deleted SMS and calllogsLOCATION - for ads

Security Master - Antivirus, VPN, AppLock, Booster APK
The original CM Security upgraded to thewhole new Security Master Antivirus&VPN(by CM, Cheetah Mobile)and redefined the scalp of Phone Security: protects not only yourphone but also your privacy. Instead of providing all the popularfeatures, Security Master Antivirus&VPN(by CM) introducedIntelligent Diagnosis to detect your phone status and advise neededsolution, including Antivirus, Junk Clean, and Phone Booster(Battery Saver, and CPU Cooler) in time. Furthermore, westrengthened the protection of privacy by creating a shield for allonline activities through SafeConnect VPN.★SafeConnect VPNSecurity Master Antivirus&VPN(by CM) presents the mosteasy-to-use free VPN, proxy & unblock solution. Apart fromother VPN, SafeConnect VPN partners with “Hotspot Shield Free VPNProxy” and was designed for everyone. SafeConnect VPN establishes asecured cyber environment as you need to block out hackers. WithSafeConnect VPN, you can apply virtual location to enhance securityand freely access favorite contents. Security MasterAntivirus&VPN(by CM) now protects not only your device, but theprotection extends to online data transmission to prevent leak ofonline banking information, private messages, and browsing history.(Will be available worldwide soon.)★Intelligent DiagnosisOur famous big button design upgraded to intelligently diagnoseyour most needed solution. All solutions to keep your phone safe,clean, and optimized like a new one, including battery.Antivirus - Security Master Antivirus&VPN(by CM) equips thecertified #1 antivirus engine. It detects 100% of virus &malware by customized scan and removes virus & malware. Itprotects phone and also your personal information against malware,spyware, and hackers.Junk Clean - Phone stores junk files automatically from time totime. Security Master Antivirus&VPN(by CM) detects this issueand frees storage when needed. One tap to clean cache & junkfiles at once. The smartest way to clean and optimize phone.Phone Boost, Battery Saver, and CPU Cooler - Your phone can nothave the best performance if it stays at a high temperature or highmemory usage. Especially when charging battery and playing games,it watches out phone & battery and keeps your phone cool, fast,and saves more battery life.★Message SecurityWorry about others peeping your message notifications? SecurityMaster Antivirus&VPN(by CM) hides notifications timely toprotect your privacy by Message Security. It gathers all chatnotifications into one and makes them easier to read &manage.★AppLockSecurity Master Antivirus&VPN(by CM) protects the privacy ofapps by AppLock. You can lock anything you want to protect, such asBluetooth & Wi-Fi switches, incoming calls, recent apps,settings, photos, WhatsApp, or any apps you choose. Furthermore,the preview of notifications can be also locked so that no one cansee which apps you are using or who you are chatting with.With Applock, you can lock apps with a pattern, PIN code, orfingerprint. Fingerprint lock is supported on Samsung or Androiddevices 6.0 and above that are equipped with fingerprint sensors.You can also customize the re-lock time to re-lock at device screenoff so that no need to unlock each time you launch an app.Intruder Selfie - Security Master Antivirus&VPN(by CM) protectsapps privacy from snoopers. If someone tries to unlock your appwith a wrong password, the photo of the intruder will automaticallybe taken and the intruder alert will be sent to you by e-mail. Itkeeps your phone safe and further tells who the intruder is.Disguise cover - Security Master Antivirus&VPN(by CM) disguiseslock screen so that no one is aware of you are using AppLock whilekeeping your secret & privacy safe. You can protect yourprivacy without your parents, partner, or children knowing.Theme - You can choose style of lock screen from hundreds ofAppLock themes or customize with your photos.