


Description
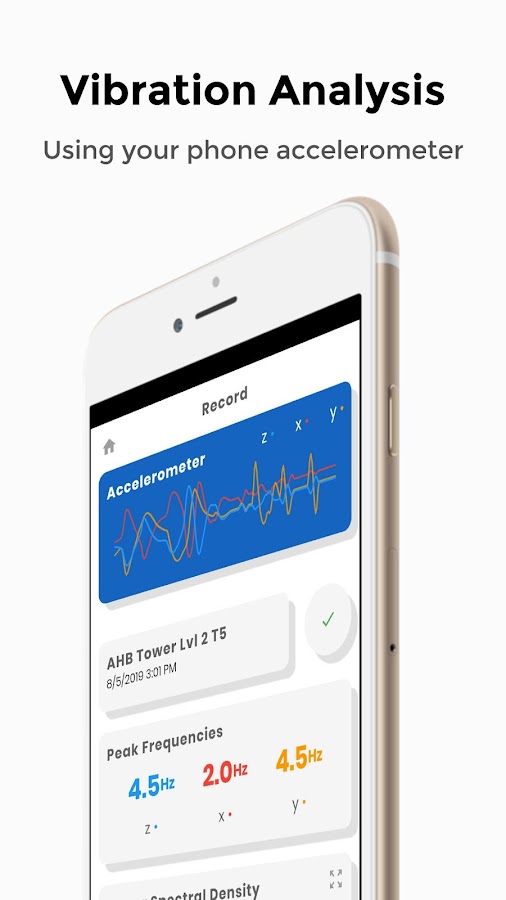
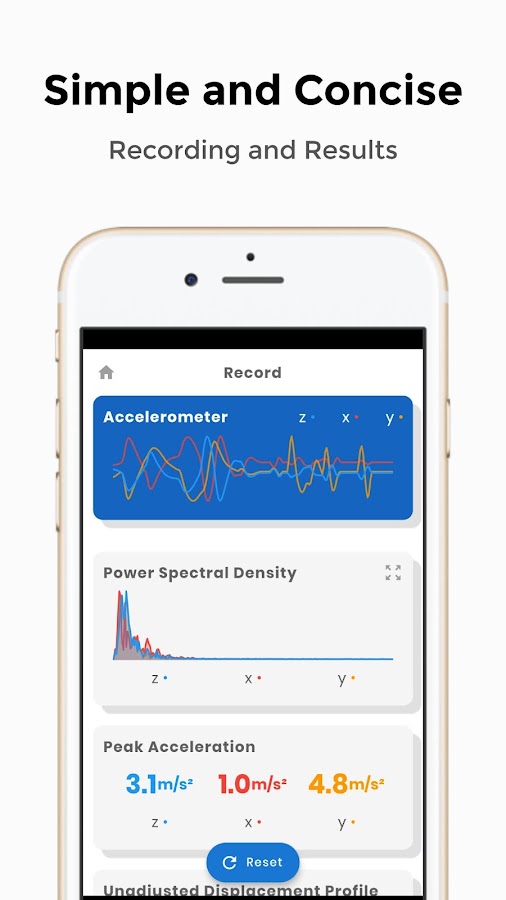
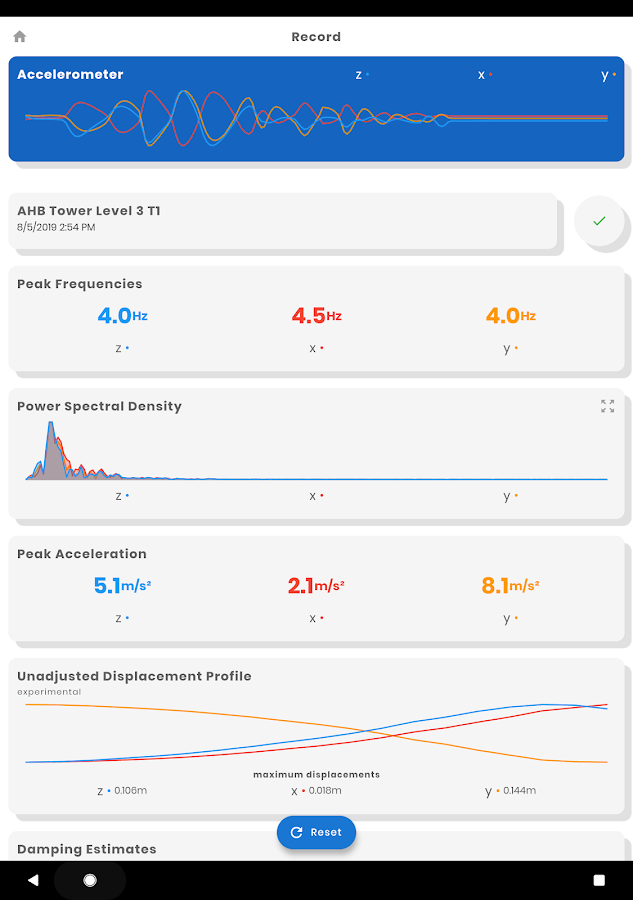
App Information Resonance - Vibration Analysis
- App NameResonance - Vibration Analysis
- Package Namecom.morganandwife.vibration
- Updated
- File SizeUndefined
- Requires AndroidAndroid
- Version1.6.5
- DeveloperKodapro
- Installs-
- PriceFree
- Category
- Developer
- Google Play Link
Resonance - Vibration Analysis Version History
Select Resonance - Vibration Analysis Version :-
Resonance - Vibration Analysis 1.6.5 APK File
Publish Date: 2022 /12/18Requires Android: Android 4.4+ (KitKat, API: 19)File Size: 4.9 MBTested on: Android 13 (Tiramisu, API: 33)File Sha1: d27c81a673a4b23b9bcd60157800902bf7609317
Kodapro Show More...


Similar Apps Show More...

vibration analysis 1.0 APK
Acceleration measurement and determination of therelevantfrequency, the acceleration and the amplitude of theoscillationExplanation of the buttons arranged on top of the screenCONTI:Continuous measurement 5 SEC: Fixed measurement duration of 5sec,then STOP automatically STOP: Stop of measurement, the last5seconds are displayed -: In stop mode, move zoom window(1.28sec)to the left, only for PRO version +: In stop mode, movezoom window(1.28sec) to the right, only for PRO version There aresevenfigures below the buttons. Upper figure "Currentaccelerationvalues": The accelerations values are displayed. Thesamplingfrequency of most smartphones is 50 Hz. If the actualsamplingfrequency deviates by ± 1 Hz, then the actual samplingfrequencyappears (flashing). Different times must then becorrectedaccordingly. The numerically displayed measured valuesarecorrected automatically. During a swipe action "from bottom lefttotop right", the APP goes into a diagnostic mode. Then theactualsampling frequency, the standard deviation of thesamplingfrequency and an internal counter appear. Underneathfigure"Accelerations over time": It shows the accelerations curveof thelast 5 seconds. After pressing STOP, a window of 1.28 sec ismarked(vertical black bars). in PRO version: the window can bemoved by±, after a double-tap on the figure it appears twice aslarge,after another double-tip it is resized again. Swipe up, swipedownto change the scaling. Underneath figure "Largest of thethreeacceleration components curve": It shows the accelerationcomponentwith the maximum acceleration change. The zoom windowisrepresented by 1.28 sec. It is particularly suitableforoscillation frequencies from 1 Hz to 15 Hz. The more sinusoidalthetime signal, the more secure are the determined values.Indiagnostic mode, trigger points and sine approximationsarevisible. In PRO version: after a double tip on the figureitappears twice as large, after another double-tip it isresizedagain. Swipe up, swipe down to change the scaling.Underneathfigure "Numerical evaluation from the time signal":Hereevaluations from the time domain are displayed numerically. Inthediagnostic mode, the number of detected vibrations aredisplayed.Sx is their standard deviation. The larger n and smallerSx, thesafer the values determined. The acceleration amplitudealsospecifies a standard deviation. The calculation is done withtheleast square method. Underneath figure "FFT-writing oftheacceleration over time": Here, a plot of the accelerationspectrumover time is shown. Shown are the last 5 seconds. The zoomwindowis marked. In PRO version: after a double tip on the figureitappears twice as large, after another double-tip it isresizedagain. Swipe up, swipe down to change the intensityscale.Underneath figure "FFT spectrum of the zoom window": It showstheFFT spectrum within the zoom window. The black curve istheresulting acceleration. In PRO version: after a double tip onthefigure it appears twice as large, after another double-tip itisresized again. Swipe up, swipe down to change thescaling.Underneath figure "FFT, numeric": It is the numeric outputof theFFT spectrum within the zoom window. The maximum of the FFTisindicated by a cross. Frequency, Amplitude and maximumaccelerationvalues are shown.


